

Question: how did you get this answer 2. Comment on Kelly's preference of the corporate value model. Based on her approach, what would Orange Brite's selling
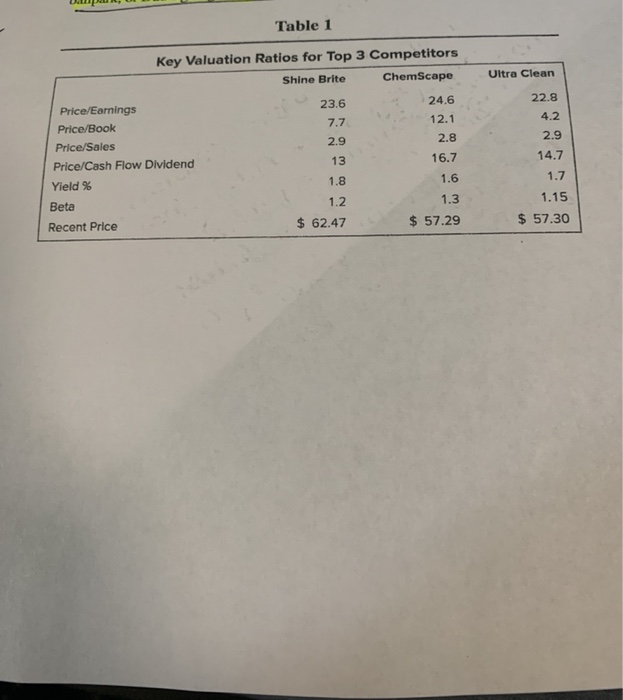
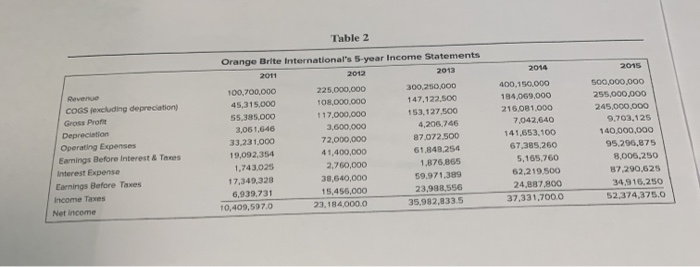
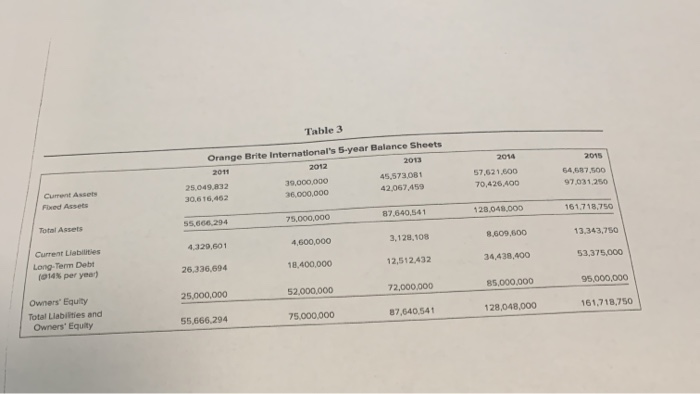
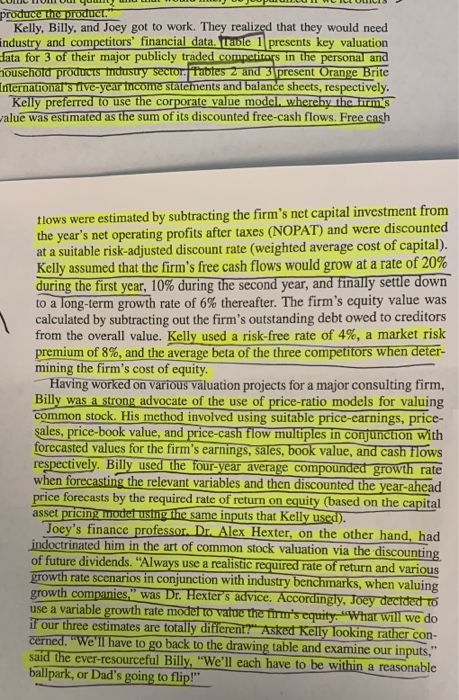
2. Comment on Kelly's preference of the corporate value model. Based on her approach, what would Orange Brite's selling price per share be if they were to issue 30 million shares? 2. Comment on Kelly's preference of the corporate value model. Based on her approach, what would Orange Brite's selling price per share be if they were to issue 30 million shares? 3. How does Kelly's price estimate compare with Billy's price estimate based on the price-ratio models? What are the pros and cons of Billy's preferred approach? Ik wat mee a Table 1 Key Valuation Ratios for Top 3 Competitors Shine Brite ChemScape Ultra Clean 22.8 23.6 7.7 24.6 12.1 2.8 4.2 2.9 2.9 13 16.7 14.7 Price/Earnings Price/Book Price/Sales Price/Cash Flow Dividend Yield % Beta Recent Price 1.8 1.6 1.7 1.2 1.15 1.3 $ 57.29 $ 62.47 $ 57.30 Table 2 2014 2015 Revenue COGS excluding depreciation Gross Profit Depreciation Operating Expenses Earnings Before interest & Taxes Interest Expense Earnings Before Taxes Income Taxes Net income Orange Brite International's 5-year Income Statements 2011 2012 2012 100,700,000 225,000,000 300.250.000 45,315.000 108.000.000 147,122.500 55,385.000 1 17.000.000 153,127.500 3,05 1,646 3.600.000 4,206,746 33.231.000 72,000,000 87.072,500 19.092,354 41,400,000 61.849,254 1.743,025 2,760,000 1.876,865 17,349,320 38,640,000 59,971,389 6,939,731 15,455,000 23,988,556 10,409,597.0 23,184,000.0 35.982.833.5 400.150.000 184.069,000 216,081.000 7,042,640 141.653.100 67.385,260 5,165,760 62.219.500 24,887,800 37,331,700.0 500,000,000 255,000,000 245,000,000 9.703.125 140,000,000 95.296,875 8,005,250 87.290.625 34.916.250 52,374,375.0 2014 2015 Table 3 Orange Brite International's 5-year Balance Sheets 2011 2012 2015 25.049,832 39.000.000 45,573,081 30.616,462 36.000.000 42,067.459 57.621.000 70,426 400 54,587,500 97.031.250 Current Assets Fixed Assets 87.640,541 120.048.000 161.718.750 55.666.294 75.000.000 Total Assets 13.343,750 3,129,108 4,600,000 8.609.500 4.329,601 34,438,400 53,375,000 12.512.432 Current Liabilities Long-Term Debi 1914% per year) 26,336,694 18.400,000 85.000.000 95,000,000 25,000,000 72,000,000 52.000.000 128,048,000 161.718.750 Owners' Equity Total Liabilities and Owners' Equity 87.640.541 55.666.294 75.000.000 produce the product." Kelly, Billy, and Joey got to work. They realized that they would need industry and competitors' financial data. Table 1 presents key valuation data for 3 of their major publicly traded competitors in the personal and household products frustry sector. Tabtes 2 and 3 present Orange Brite International's Tive-year frcome statements and balance sheets, respectively. Kelly preferred to use the corporate value model, whereby the firm's value was estimated as the sum of its discounted free-cash flows. Free cash flows were estimated by subtracting the firm's net capital investment from the year's net operating profits after taxes (NOPAT) and were discounted at a suitable risk-adjusted discount rate (weighted average cost of capital). Kelly assumed that the firm's free cash flows would grow at a rate of 20% during the first year, 10% during the second year, and finally settle down to a long-term growth rate of 6% thereafter. The firm's equity value was calculated by subtracting out the firm's outstanding debt owed to creditors from the overall value. Kelly used a risk-free rate of 4%, a market risk premium of 8%, and the average beta of the three competitors when deter- mining the firm's cost of equity. Having worked on various valuation projects for a major consulting firm, Billy was a strong advocate of the use of price-ratio models for valuing common stock. His method involved using suitable price-earnings, price- sales, price-book value, and price-cash flow multiples in conjunction with forecasted values for the firm's earnings, sales, book value, and cash flows respectively. Billy used the four-year average compounded growth rate when forecasting the relevant variables and then discounted the year-ahead price forecasts by the required rate of return on equity (based on the capital asset pricing model using the same inputs that Kelly used). Joey's finance professor. Dr. Alex Hexter, on the other hand, had indoctrinated him in the art of common stock valuation via the discounting of future dividends. Always use a realistic required rate of return and various growth rate scenarios in conjunction with industry benchmarks, when valuing growth companies." was Dr. Hexter's advice. Accordingly, Joey decided to use a variable growth rate model to value the firm's equity. "What will we do if our three estimates are totally different? Asked Kelly looking rather con- cerned. "We'll have to go back to the drawing table and examine our inputs," said the ever-resourceful Billy, "We'll each have to be within a reasonable ballpark, or Dad's going to flip
Step by Step Solution
There are 3 Steps involved in it

Get step-by-step solutions from verified subject matter experts