

Question: How do I answer this question with a graph/ what would the graph look like? 2.=('25 points) In an effort to win a Congressional seat
How do I answer this question with a graph/ what would the graph look like?
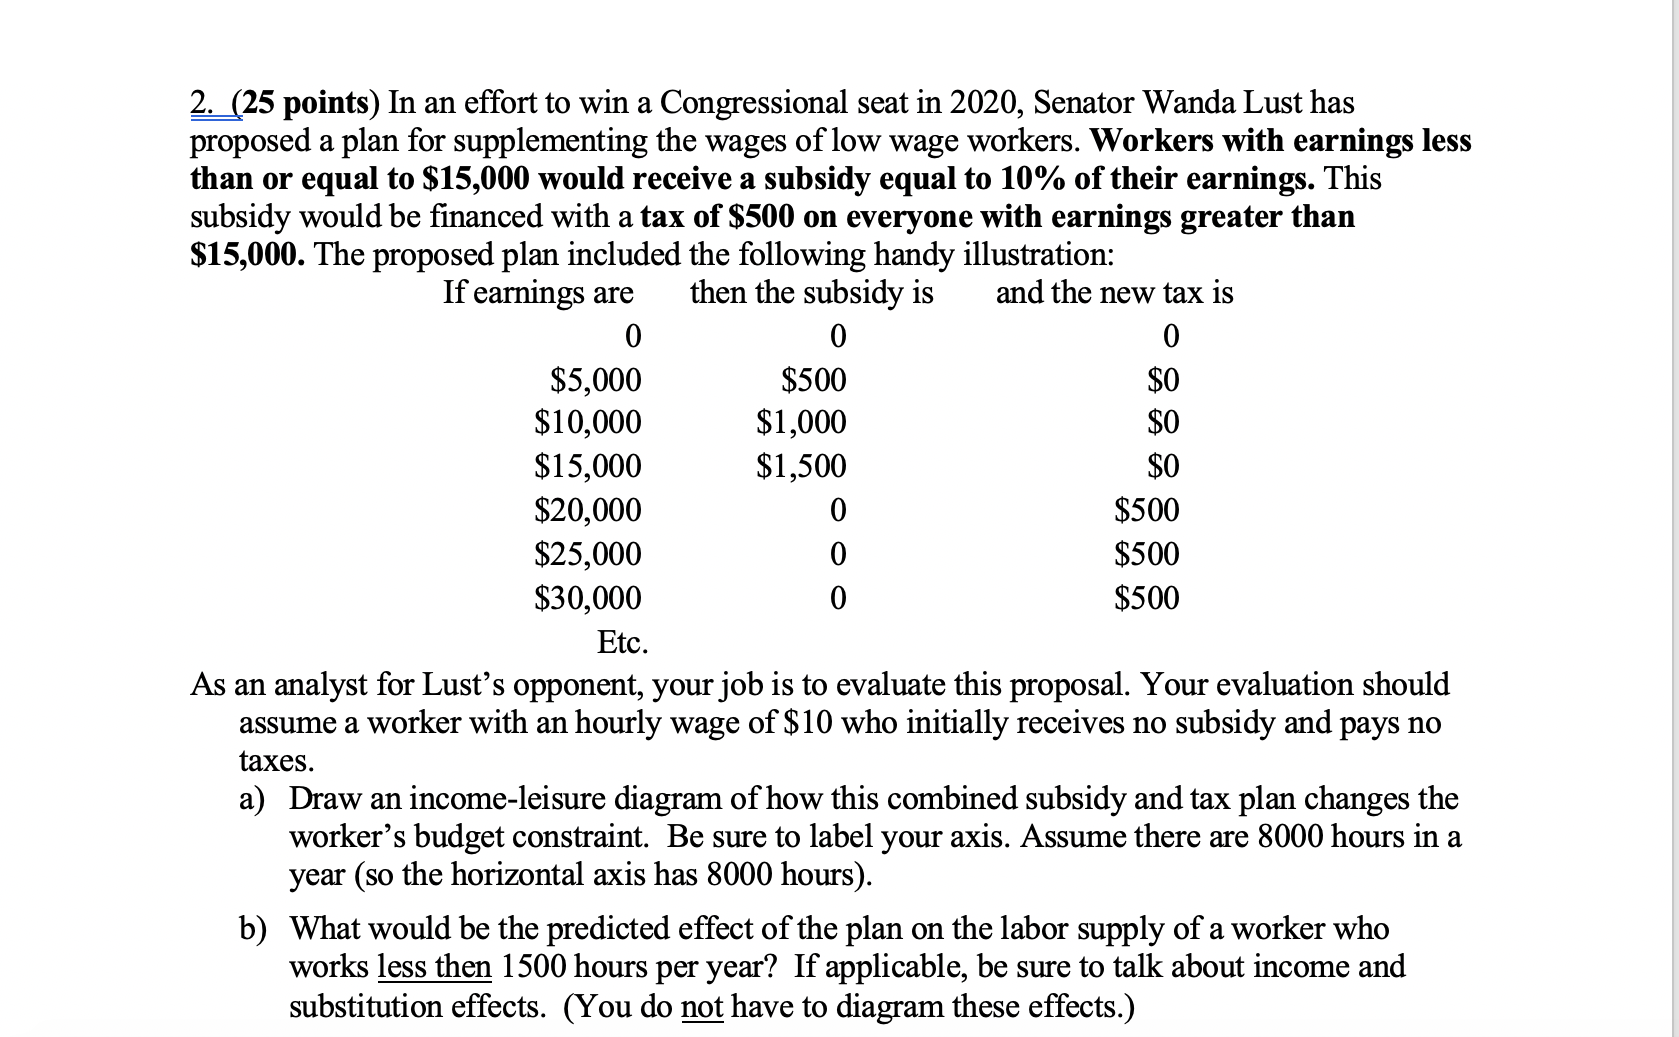
2.=('25 points) In an effort to win a Congressional seat in 2020, Senator Wanda Lust has proposed a plan for supplementing the wages of low wage workers. Workers with earnings less than or equal to $15,000 would receive a subsidy equal to 10% of their earnings. This subsidy would be nanced with a tax of $500 on everyone with earnings greater than $15,000. The proposed plan included the following handy illustration: If eamings are then the subsidy is and the new tax is 0 0 0 $5,000 $500 $0 $10,000 $1,000 $0 $15,000 $1,500 $0 $20,000 0 $500 $25,000 0 $500 $30,000 0 $500 Etc. As an analyst for Lust's opponent, your job is to evaluate this proposal. Your evaluation should assume a worker with an hourly wage of $10 who initially receives no subsidy and pays no taxes. a) Draw an income-leisure diagram of how this combined subsidy and tax plan changes the worker's budget constraint. Be sure to label your axis. Assume there are 8000 hours in a year (so the horizontal axis has 8000 hours). b) What would be the predicted effect of the plan on the labor supply of a worker who works less then 1500 hours per year? If applicable, be sure to talk about income and substitution effects. (You do 1g have to diagram these effects.)
Step by Step Solution
There are 3 Steps involved in it

Get step-by-step solutions from verified subject matter experts