

Question: how do i create these 3 lines in excel in chart form from the data table that is given in the photo. i am struggling
how do i create these 3 lines in excel in chart form from the data table that is given in the photo. i am struggling to create the break even line for this chart 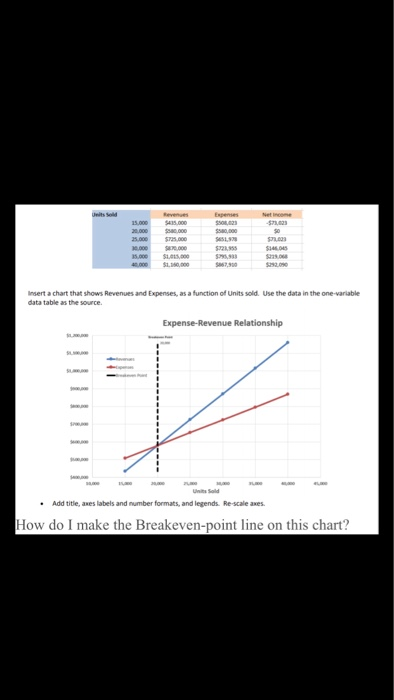
Insert a chart that shows Revenues and Expenses as a function of Units sold Use the data in the one variable datatable as the source Expense-Revenue Relationship Add title, are labels and number formats, and legends Re-scale anes How do I make the Breakeven-point line on this chart? Insert a chart that shows Revenues and Expenses as a function of Units sold Use the data in the one variable datatable as the source Expense-Revenue Relationship Add title, are labels and number formats, and legends Re-scale anes How do I make the Breakeven-point line on this chart
Step by Step Solution
There are 3 Steps involved in it
1 Expert Approved Answer
Step: 1 Unlock

Question Has Been Solved by an Expert!
Get step-by-step solutions from verified subject matter experts
Step: 2 Unlock
Step: 3 Unlock