

Question: how do I determine the conditional proportions on poverty level for each region? I got at least one of the answers in theboxegs wrong but
how do I determine the conditional proportions on poverty level for each region? I got at least one of the answers in theboxegs wrong but can't figure out which one
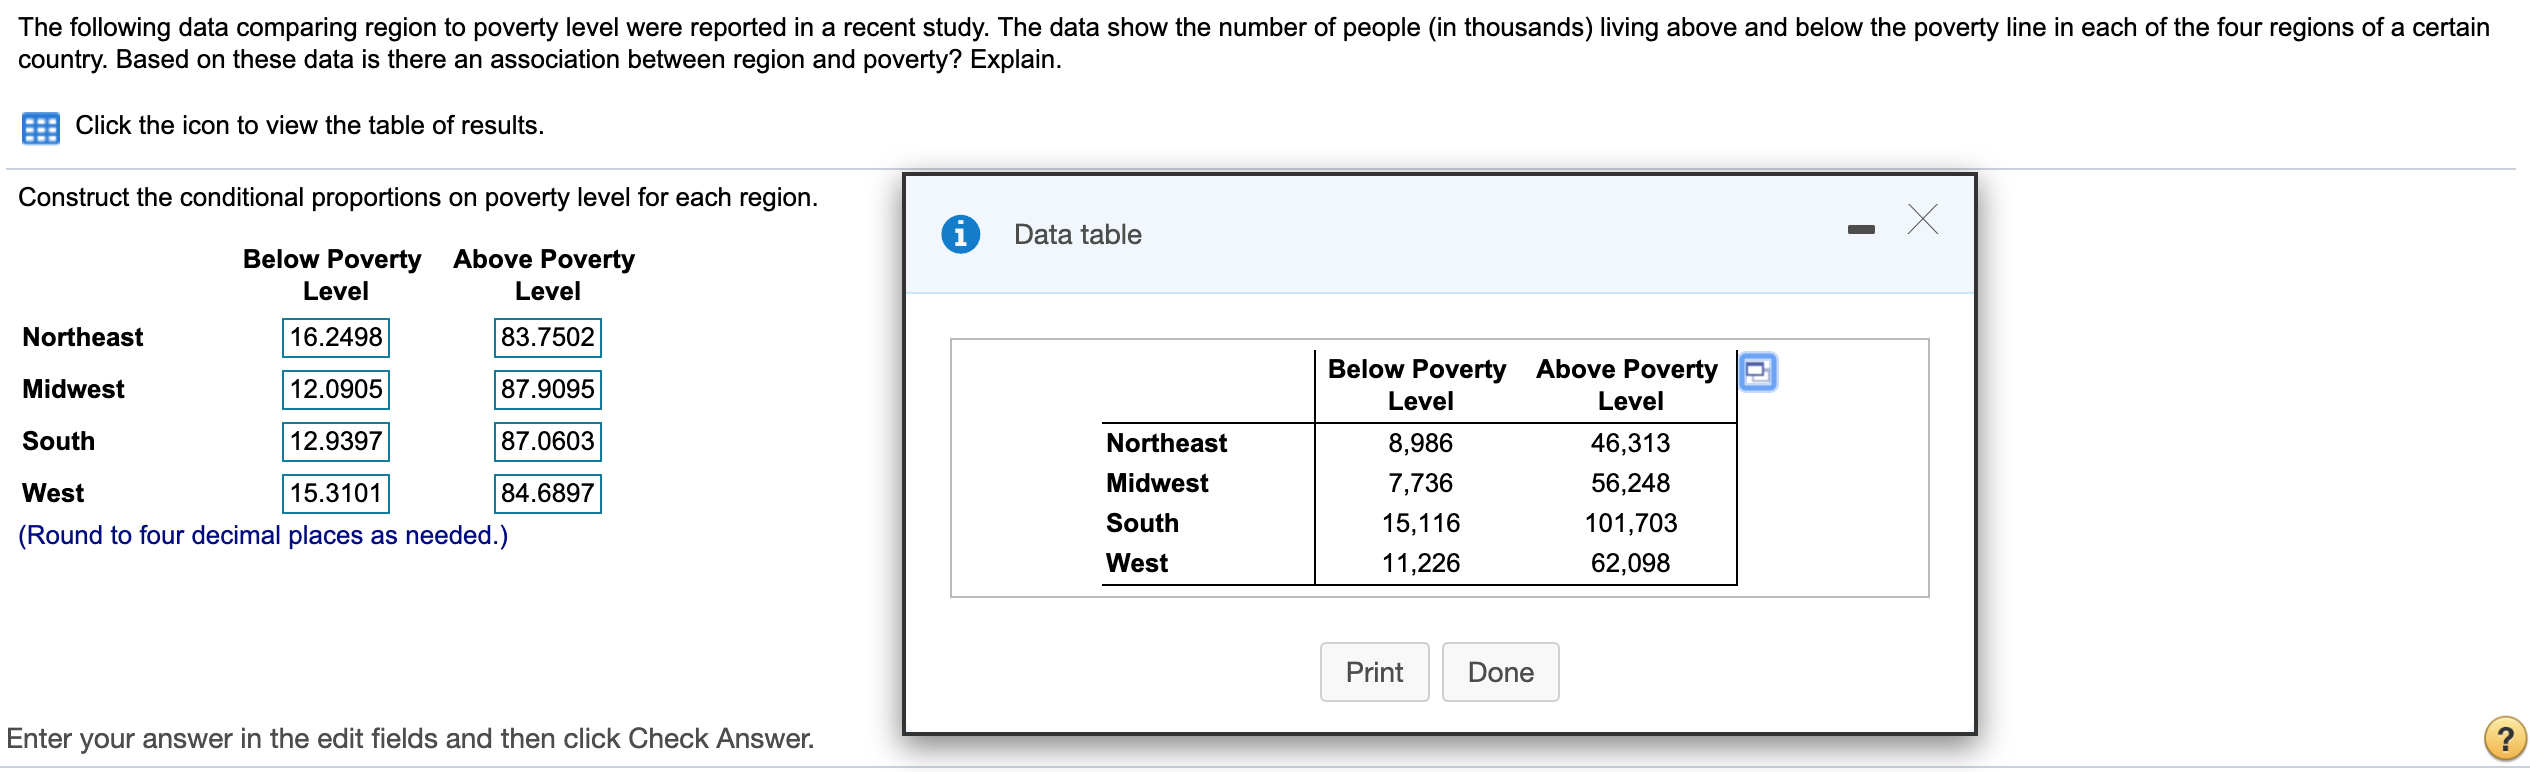
The following data comparing region to poverty level were reported in a recent study. The data show the number of people (in thousands) living above and below the poverty line in each of the four regions of a certain country. Based on these data is there an association between region and poverty? Explain. a Click the icon to view the table of results. Construct the conditional proportions on poverty level for each region. 0 Data table Below Poverty Above Poverty Level Level Northeast 16 .2498 83.7502 . Below Poverty Above Poverty E Mldwest 12.0905 87.9095 Level Level South 12.9397 87.0603 Northeast 8,986 46,313 West 153101 846897 Midwest 7,736 56,248 (Round to four decimal places as needed.) South 15'116 101]\" West 11,226 62,098 ' Print\" ' Done ' Enter your answer in the edit fields and then click Check
Step by Step Solution
There are 3 Steps involved in it

Get step-by-step solutions from verified subject matter experts