

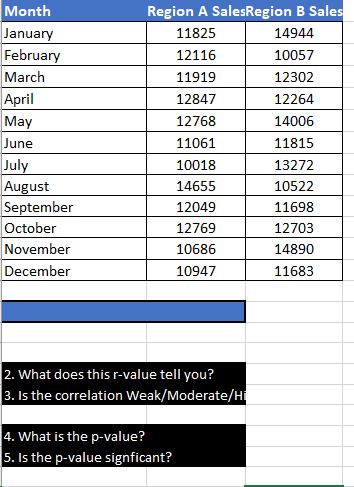
Question: How do i find the correlation? begin { tabular } { | l | c | c | } hline Month &
How do i find the correlation? begintabularlcc
hline Month & multicolumnc Region A SalesRegion B Sales
hline January & &
hline February & &
hline March & &
hline April & &
hline May & &
hline June & &
hline July & &
hline August & &
hline September & &
hline October & &
hline November & &
hline December & &
hline
endtabular
What does this rvalue tell you?
Is the correlation WeakModerateH
What is the pvalue?
Is the pvalue signficant?
Step by Step Solution
There are 3 Steps involved in it
1 Expert Approved Answer
Step: 1 Unlock

Question Has Been Solved by an Expert!
Get step-by-step solutions from verified subject matter experts
Step: 2 Unlock
Step: 3 Unlock