

Question: How do I tabulate the variable 'marital' in python Descriptive Statistics Let's start with some basic descriptive statistics on the sample. This wilt take a
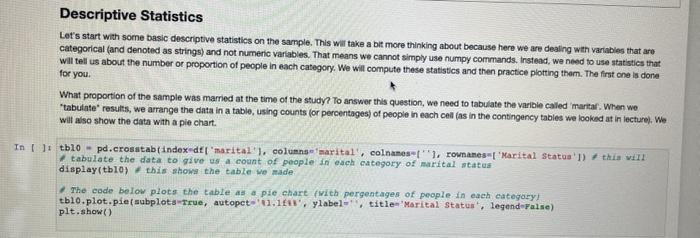
Descriptive Statistics Let's start with some basic descriptive statistics on the sample. This wilt take a bit more thinking about because here we are dealing wath vartables that are categorical (and denoted as strings) and not numeric variables. That means we cannot simply use numpy commands. Instead, we nesd to use statistics that Will tell us about the number or proportion of people in each category. We will compute these statistics and then practice plotting them. The first one is done for you. What proportion of the sample was married at the time of the study? To answer this question, we need to tabulate the varibie called imaritar. When we "tabuiate" results, we arrange the cdata in a table, using counts (or percentages) of people in each cell (as in the contingency tables we looked at in lecture). We will also show the dota with a pie chart. tabulate- the data to give us a count of poople in each category of marital stater display(tblo) fois showg the table we made: The code below plotg the table as a pie chart fwich pergentages of people in each categoryl plt.show()
Step by Step Solution
There are 3 Steps involved in it

Get step-by-step solutions from verified subject matter experts