Question: how do we know the output range?could you explain it 4-12 Using computer software, find the least-squares regression line for the data in Problem 4-10.

how do we know the output range?could you explain
how do we know the output range?could you explain it how do we know the output range?could you explain
4-12 Using computer software, find the least-squares regression line for the data in Problem 4-10. Based on the F test, is there a statistically significant relationship between the demand for guitars and the number of YouTube views? From From New Database HTML Text Query Refresh All Edit Links Regression G8 Input OK Input Y Range: A $A$7:$A$12 D Cancel 1 2 Input X Range: $8$7:$B$12 4-12 Using computer software, find the least squares regression line for the data in Pa Based on the F test, is there a statistically significant relationship between the demand for guit YouTube views Labels Constant is Zero Confidence Level: 95 Output options 6 YouTube Views Guitar Sales 30 40 9 70 10 60 11 80 12 SO 11 12 10 15 13 Output Range: New Worksheet Ply: New Workbook Residuals 14 Residuals Residual Plots 15 16 Standardized Residuals Line Fit Plots 17 18 Normal Probability 19 20 21 Normal Probability Plots 22 24

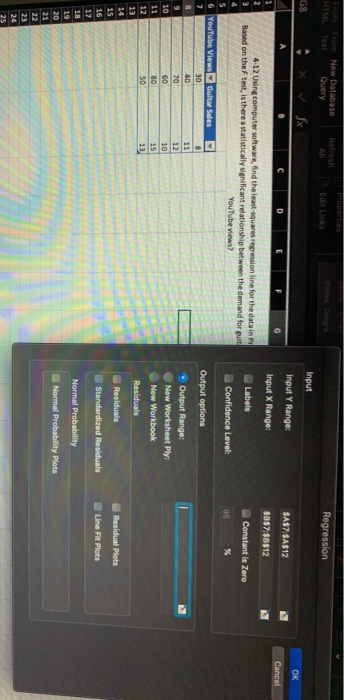
Step by Step Solution

There are 3 Steps involved in it

1 Expert Approved Answer
Step: 1 Unlock blur-text-image
Question Has Been Solved by an Expert!

Get step-by-step solutions from verified subject matter experts

Step: 2 Unlock
Step: 3 Unlock

Students Have Also Explored These Related General Management Questions!