

Question: How do you solve Questions 1 - 3? I have the link the excel if needed WPro1sseKCm IRead-Unly Ecel Sgn PAGE LAVOUT FLE HOME NSERT
How do you solve Questions 1 - 3? I have the link the excel if needed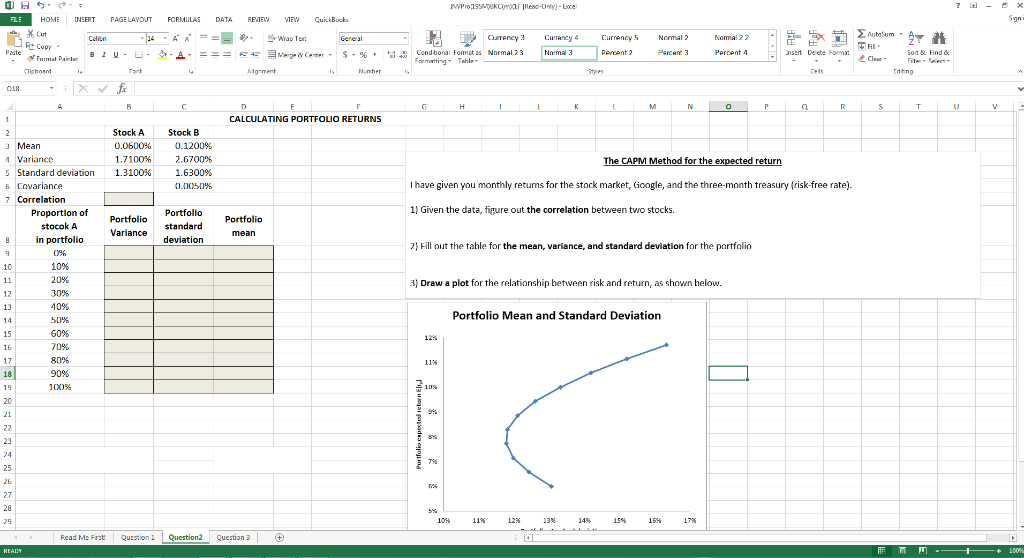
WPro1sseKCm IRead-Unly Ecel Sgn PAGE LAVOUT FLE HOME NSERT FORMULAS 0ATA REVIEW MEW CuiBack Sum A 14 Wrap Ter Geneal Curency Cuancy Currency: Normal 2 Nomal 2 2 Calien FCom = Merge& Center Faste A Normal 25 Normal 3 Peent 2 Parcere 3 Percent 4 nsert De etu Format Sort &Find o BIU- Farmat Painte Cler aicbosrd Algrment Number tdeng 018 F F G M. N CALCULATING PORTFOLIO RETURNS 1 Stock A Stock B Mean 1.7100 % Variance 7 6700% The CAPM Method for the expected return 1.3100 % 5 Standard deviation .6300% I have given you monthly retums for the stock market, Gioogle, and the three-month treasury (risk-free rate). 6Covariance p.0050% 7 Correlation 1) Given the data, finure out the correlation between two stocks. Proportion of Portfollo Portfolio Portfolio stocok tandar Variance mean o i.. in p 2)Fill out the table f the mean, variance, and standard deviation for the portfolio % 10% 10 20% 3) Draw a plot for the relationship between risk and return, as shown helow 11 30% 13 Portfolio Mean and Standard Deviation 60% 15 12% 70% 16 80% 17 90 % 18| 10% 100% 15 21 22 23 24 25 26 27 5e 11% 1239 13% 14% 15% 16% 17 Read Me Firsts Question 1 Ourstion? Question 3 READ
Step by Step Solution
There are 3 Steps involved in it

Get step-by-step solutions from verified subject matter experts