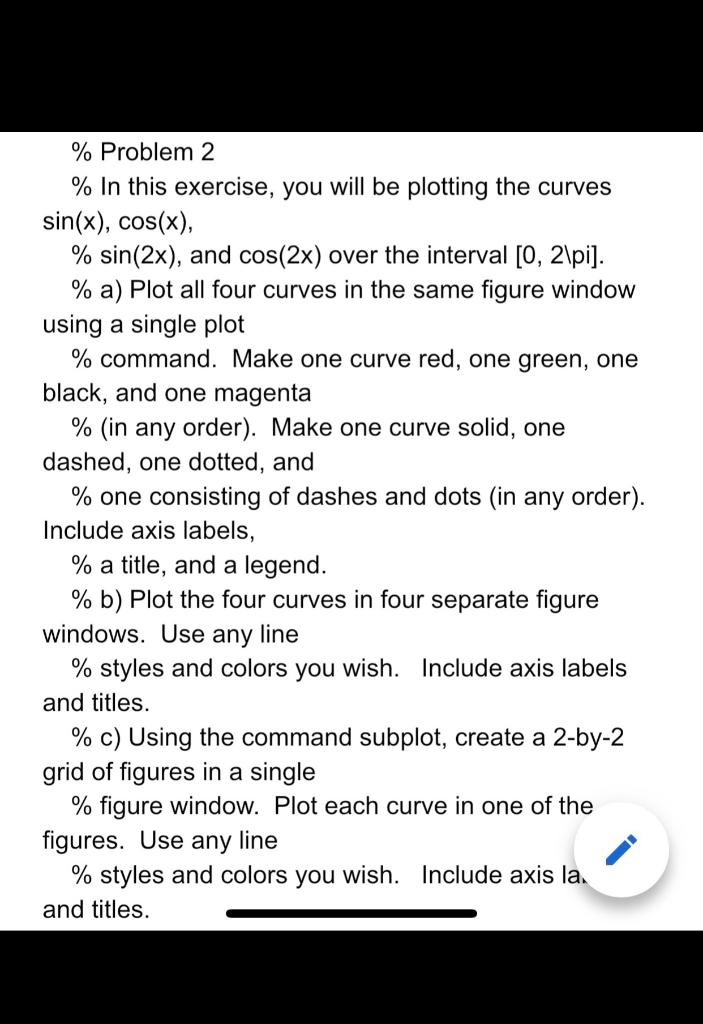
Question: How do you solve this problem on MATLAB? % Problem 2 % In this exercise, you will be plotting the curves sin(x), cos(x), % sin(2x),

How do you solve this problem on MATLAB?

How do you solve this problem on MATLAB? %

% Problem 2 % In this exercise, you will be plotting the curves sin(x), cos(x), % sin(2x), and cos(2x) over the interval [0, 2\pi). % a) Plot all four curves in the same figure window using a single plot % command. Make one curve red, one green, one black, and one magenta % (in any order). Make one curve solid, one dashed, one dotted, and % one consisting of dashes and dots in any order). Include axis labels, % a title, and a legend. % b) Plot the four curves in four separate figure windows. Use any line % styles and colors you wish. Include axis labels and titles. % c) Using the command subplot, create a 2-by-2 grid of figures in a single % figure window. Plot each curve in one of the figures. Use any line % styles and colors you wish. Include axis la. and titles

Step by Step Solution

There are 3 Steps involved in it

1 Expert Approved Answer
Step: 1 Unlock blur-text-image
Question Has Been Solved by an Expert!

Get step-by-step solutions from verified subject matter experts

Step: 2 Unlock
Step: 3 Unlock

Students Have Also Explored These Related Databases Questions!