

Question: How to add percent to the same graph( with same colors & country names) instead of count? using R code. The code used to get
How to add percent to the same graph( with same colors & country names) instead of count? using R code.
The code used to get this table &graph is given above table.
Im unable to send data, kindly tell me how to provide data
| suicide_rates |
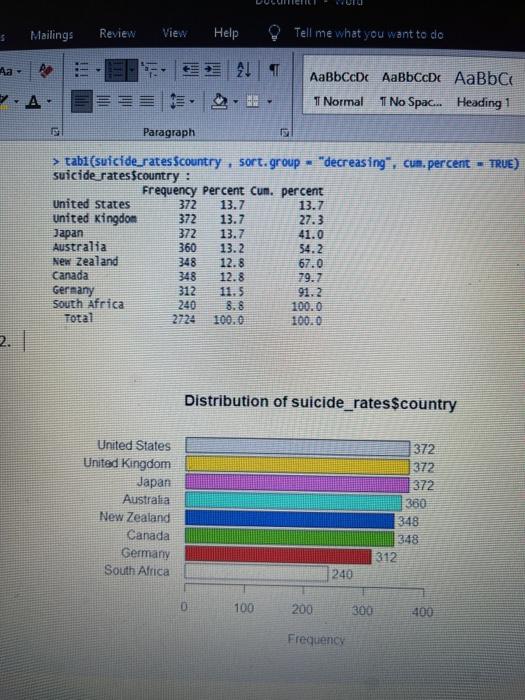
Mailings Review View Help Tell me what you want to do 2 T AaBbCcDc AaBbCcDc AaBb C 1 Normal I No Spac... Heading 1 5 Paragraph > tabl(suicidesates Scountry, sort.group = "decreasing", cum. percent - TRUE) suicide rates $country : Frequency Percent cum. percent United States 372 13.7 13.7 United Kingdom 372 13.7 27.3 Japan 372 13.7 41.0 Australia 360 13.2. 54.2 New Zealand 348 12.8 67.0 Canada 348 12.8 79.7 Germany 312 11.5 91.2 South Africa 240 Total 2724 100.0 Distribution of suicide_rates $country United States United Kingdom Japan Australia New Zealand Canada Germany South Africa 372 372 372 380 1348 348 312 240 D 100 200 300 400 Frequency
Step by Step Solution
There are 3 Steps involved in it

Get step-by-step solutions from verified subject matter experts