

Question: how to develop a cumulative distribution function table. Based on the Consumer Transportation Survey data below, develop a probability mass function and cumulative distribution function
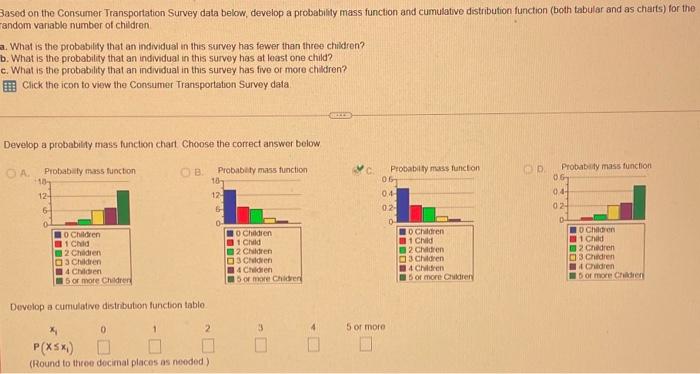
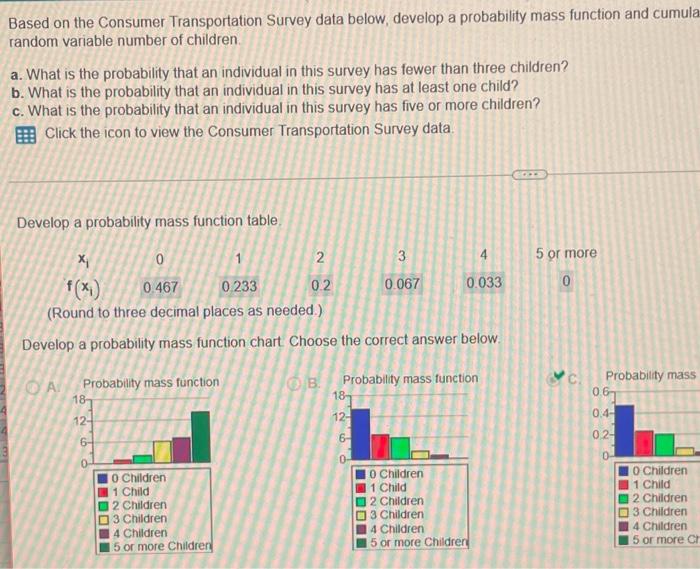
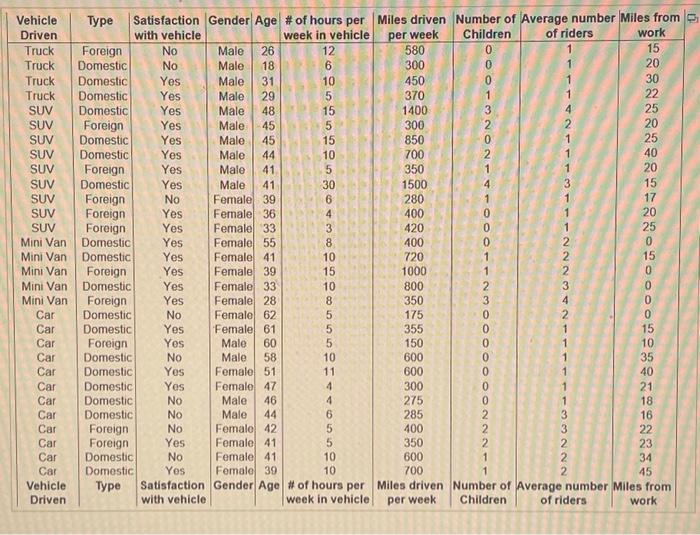
Based on the Consumer Transportation Survey data below, develop a probability mass function and cumulative distribution function (both tabular and as charts) for the random variable number of children. a. What is the probability that an individual in this survey has fewer than three children? b. What is the probability that an individual in this survey has at least one child? c. What is the probability that an individual in this survey has five or more children? Click the icon to view the Consumer Transportation Survey data. Develop a probability mass function chart Choose the correct answer below. OA. Probability mass function 10 12- 6 0 0 Children 1 Child 2 Children 3 Children 4 Children 5 or more Children Develop a cumulative distribution function table P(XSX,) (Round to three decimal places as needed) 0 OB. 1 Probability mass function 187 12- 6 0- 2 10 Children 11 Child 2 Children 3 Children 4 Children 5 or more Children 0 4 ROCKE C. 5 or more L Probability mass function 06 04- 02- 0 0 Children 1 Child 12 Children 3 Children 4 Children 5 or more Children OD Probability mass function 06 04- 02- 0 B 10 Children 1 Child 2 Children 3 Children 4 Children 5 or more Children Based on the Consumer Transportation Survey data below, develop a probability mass function and cumula random variable number of children. a. What is the probability that an individual in this survey has fewer than three children? b. What is the probability that an individual in this survey has at least one child? c. What is the probability that an individual in this survey has five or more children? Click the icon to view the Consumer Transportation Survey data. Develop a probability mass function table. x 0 1 f(x) 0.467 0.233 (Round to three decimal places as needed.) Develop a probability mass function chart Choose the correct answer below. A Probability mass function 187 12- 6- 0 Children 1 Child 2 Children 3 Children 4 Children 15 or more Children 2 0.2 OB 3 0.067 18- 12- 6- Probability mass function 0 Children 1 Child 2 Children 3 Children 0.033 4 Children 5 or more Children 5 or more 0 C. Probability mass 0.61 0.4- 0,2- 0- 0 Children 1 Child 2 Children 3 Children 4 Children 5 or more Ch Vehicle Type Driven Truck Foreign Truck Domestic Truck Domestic Truck Domestic SUV Domestic SUV SUV SUV Domestic SUV Foreign SUV Domestic SUV Foreign Foreign SUV SUV Mini Van Mini Van Mini Vani Mini Vani Mini Van Car Car Car Foreign Domestic Car Car Domestic Foreign Domestic Foreign Domestic Domestic Foreign Domestic Domestic Domestic Domestic Domestic Foreign Car Foreign Car Domestic Car Domestic Car Car Car Car Vehicle Driven Foreign Domestic Satisfaction Gender Age # of hours per with vehicle week in vehicle 12 No No Yes Yes Yes Yes Yes Yes Yes Yes No Yes Yes Yes Yes Yes Male 26 Male 18 31 29 48 45 45 44 41. Male 41 Female 39 Female 36 Female 33 Male Male Male Male Male Male Male Female 55 Female 41 Female 39 Yes Yes No Yes Yes No Yes Yes Female 47 No No Male 46 Male 44 Female 42 Female 411 No Yes Female 41 No Yos Female 39 Type Satisfaction Gender Age with vehicle Female 33 Female 28 Female 62 Female 611 60 Male Male 58 Female 51 DHHSULOTO WASHSHSHSN 10 15 15 10 30 10 15 10 10 11 4 65509 10 10 Miles driven Number of Average number Miles from Children per week work of riders 15 20 580 300 450 370 1400 300 850 700 350 1500 280 400 420 400 720 1000 800 350 175 355 150 600 600 300 275 285 400 350 600 700 0 60013202T 1 1 1 2 3 0 0 0 0 0 0 6222-- 1 1 1 2223. 4 1 3 2 2 2 30 22 25 20 25 40 20 15 17 20 25 0 15 0 0 0 0 15 10 35 40 21 18 16 22 23 34 45 # of hours per Miles driven Number of Average number Miles from week in vehicle per week Children of riders work
Step by Step Solution
There are 3 Steps involved in it

Get step-by-step solutions from verified subject matter experts