

Question: How to graph this information? Creating a plot of original data and graphing the sine function and a second graph of the cos function world
How to graph this information? Creating a plot of original data and graphing the sine function and a second graph of the cos function
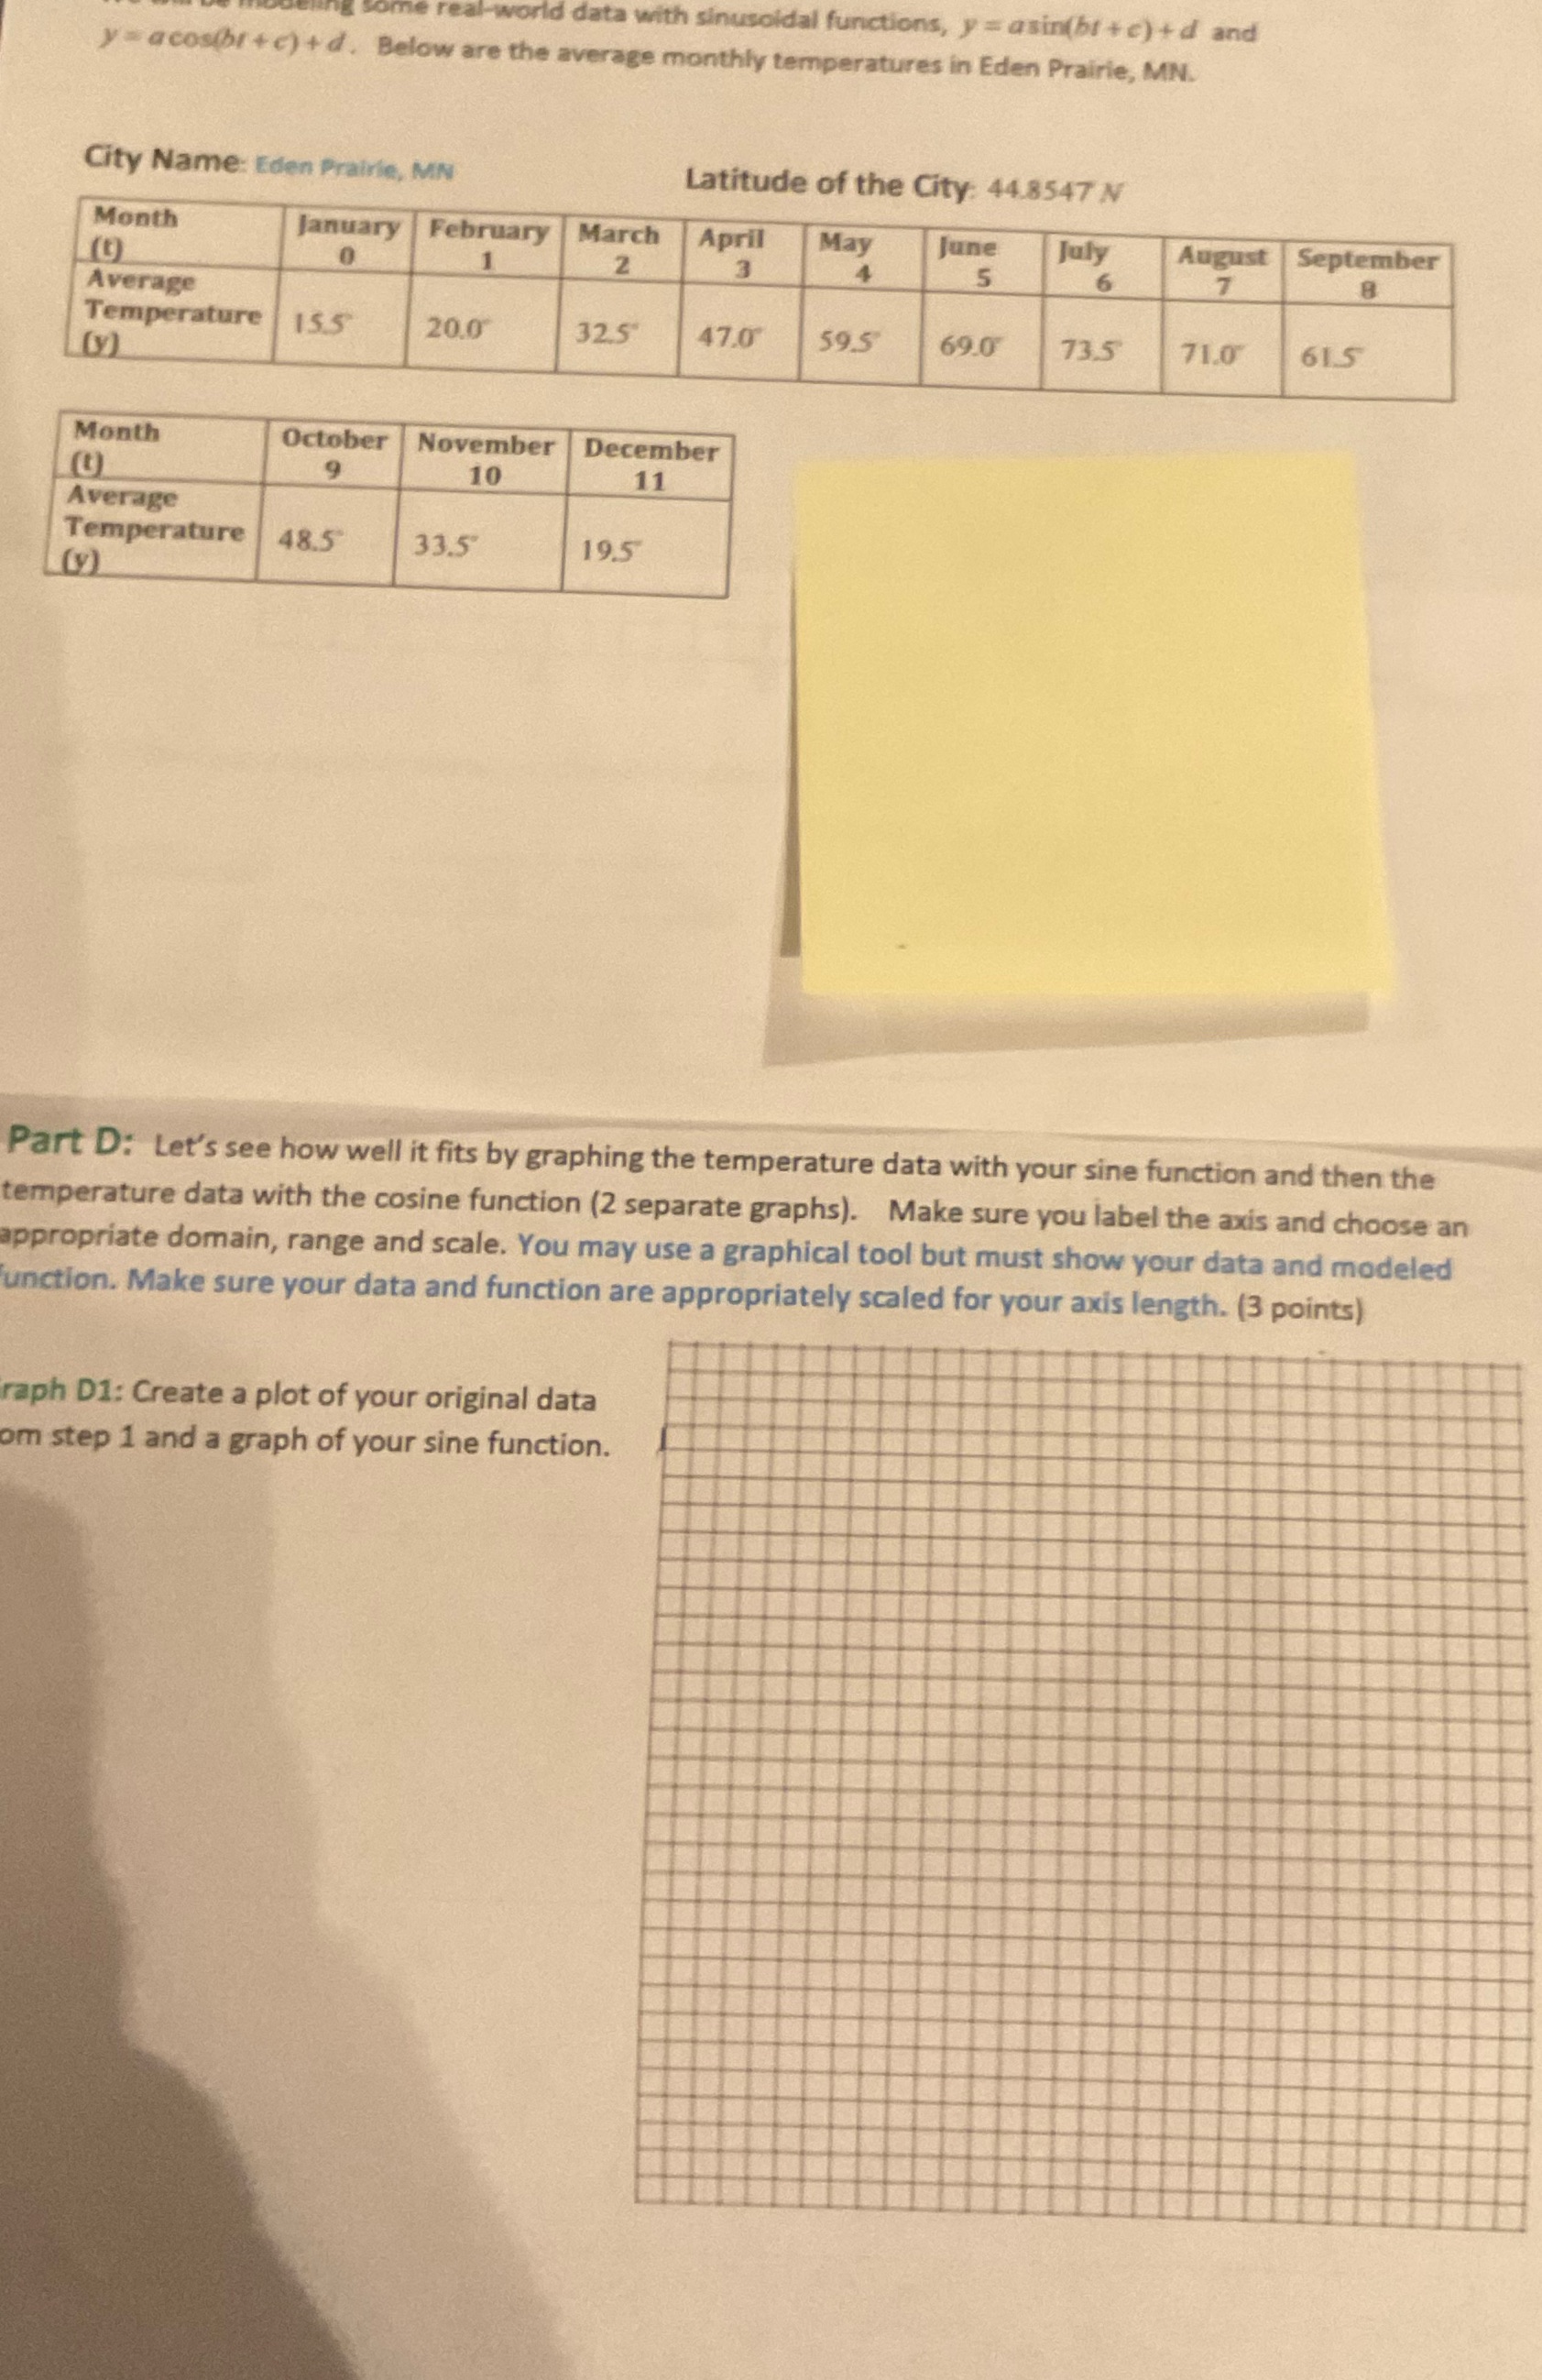
world data with sinusoidal functions, y = asin(bi +c) +d and y = acosibr +c) + d. Below are the average monthly temperatures in Eden Prairie, MN. City Name: Eden Prairie, MN Latitude of the City: 44.8547 N Month January | February March April May June July August September Average Temperature 155 20.0 32.5" 470 595 69.0 73.5 71.0 615 (y) Month October November December 10 11 Average Temperature 48.5 33.5" 19.5 (y) Part D: Let's see how well it fits by graphing the temperature data with your sine function and then the temperature data with the cosine function (2 separate graphs). Make sure you label the axis and choose an appropriate domain, range and scale. You may use a graphical tool but must show your data and modeled unction. Make sure your data and function are appropriately scaled for your axis length. (3 points) raph D1: Create a plot of your original data om step 1 and a graph of your sine function
Step by Step Solution
There are 3 Steps involved in it

Get step-by-step solutions from verified subject matter experts