

Question: How to label points in plot like in the picture? Like with the dots and numbers of top ? Using MATLAB 8000 9000 7000 5000
How to label points in plot like in the picture? Like with the dots and numbers of top ? Using MATLAB 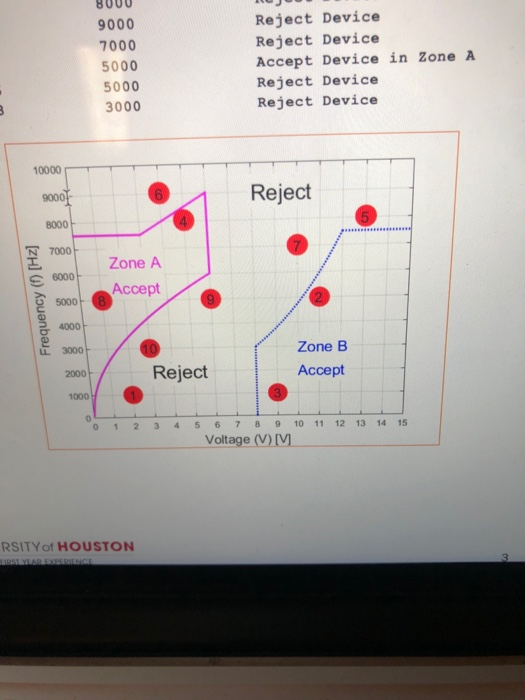
8000 9000 7000 5000 5000 3000 Reject Device Reject Device Accept Device in Zone A Reject Device Reject Device 10000 1Reject 900 8000 Zone A 6000 50000 Accept 4000 2 3000 2000 1000 Zone B Accept Reject o12 345678 9 10 11 12 13 14 15 Voltage (V)[V RSITYof HOUSTON
Step by Step Solution
There are 3 Steps involved in it
1 Expert Approved Answer
Step: 1 Unlock

Question Has Been Solved by an Expert!
Get step-by-step solutions from verified subject matter experts
Step: 2 Unlock
Step: 3 Unlock