

Question: How to modify/fix this RStudio code so that in the load_forecast chart the Daily_Peak_Load column is no longer N/A but the calculated values for load
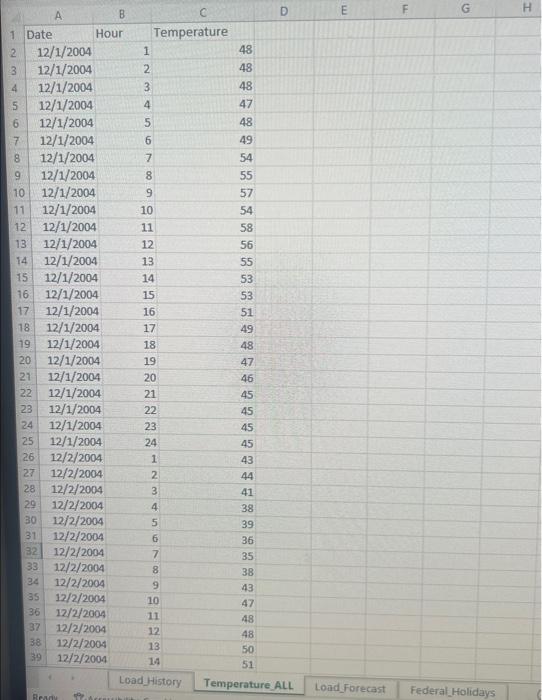
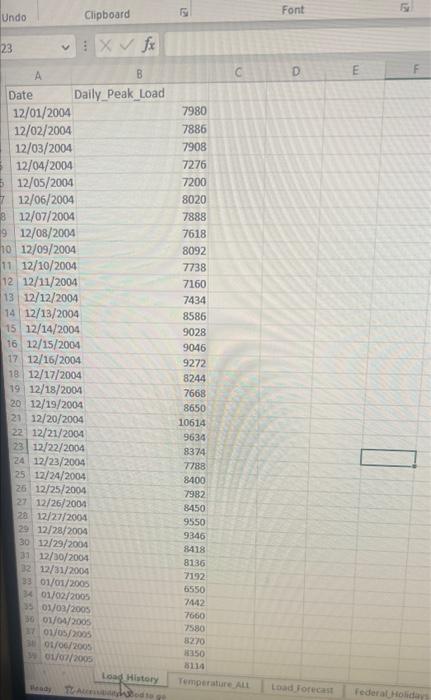
How to modify/fix this RStudio code so that in the load_forecast chart the Daily_Peak_Load column is no longer N/A but the calculated values for load for every day in 2008 based upon max temp of previous days and so the "object 'Tempature' not found" error dissapears. The excel charts used for this are also depicted below alongside the code. I am trying to use the maximum tempature of each day to predict daily peak load but there are errors.


Code:
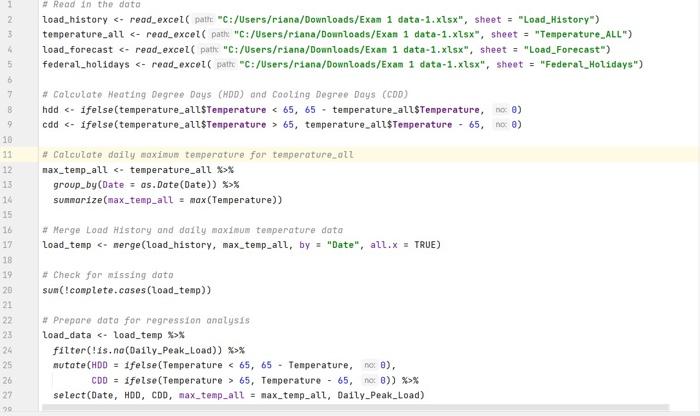
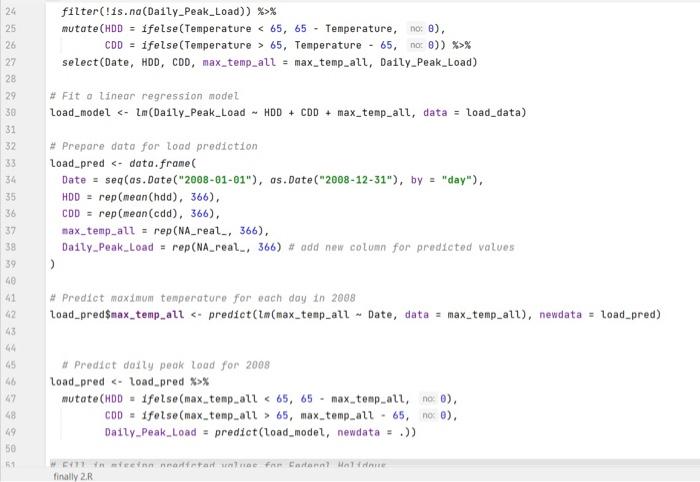
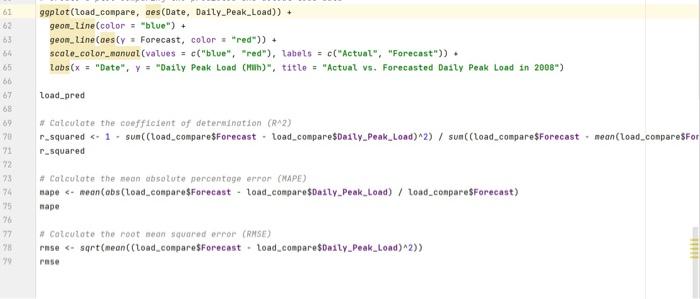
# Read in the data load_history read_excel("C:/Users/data-1.xlsx", sheet = "Load_History") temperature_all read_excel("C:/Users/ data-1.xlsx", sheet = "Temperature_ALL") load_forecast read_excel("C:/Users/ data-1.xlsx", sheet = "Load_Forecast") federal_holidays read_excel("C:/Users/ data-1.xlsx", sheet = "Federal_Holidays") # Calculate Heating Degree Days (HDD) and Cooling Degree Days (CDD) hdd ifelse(temperature_all$Temperature 65, 65 - temperature_all$Temperature, 0) cdd ifelse(temperature_all$Temperature > 65, temperature_all$Temperature - 65, 0) # Calculate daily maximum temperature for temperature_all max_temp_all % group_by(Date = as.Date(Date)) %>% summarize(max_temp_all = max(Temperature)) # Merge Load History and daily maximum temperature data load_temp merge(load_history, max_temp_all, by = "Date", all.x = TRUE) # Check for missing data sum(!complete.cases(load_temp)) # Prepare data for regression analysis load_data % filter(!is.na(Daily_Peak_Load)) %>% mutate(HDD = ifelse(Temperature 65, 65 - Temperature, 0), CDD = ifelse(Temperature > 65, Temperature - 65, 0)) %>% select(Date, HDD, CDD, max_temp_all = max_temp_all, Daily_Peak_Load) # Fit a linear regression model load_model lm(Daily_Peak_Load ~ HDD + CDD + max_temp_all, data = load_data) # Prepare data for load prediction load_pred data.frame( Date = seq(as.Date("2008-01-01"), as.Date("2008-12-31"), by = "day"), HDD = rep(mean(hdd), 366), CDD = rep(mean(cdd), 366), max_temp_all = rep(NA_real_, 366), Daily_Peak_Load = rep(NA_real_, 366) # add new column for predicted values ) # Predict maximum temperature for each day in 2008 load_pred$max_temp_all predict(lm(max_temp_all ~ Date, data = max_temp_all), newdata = load_pred) # Predict daily peak load for 2008 load_pred % mutate(HDD = ifelse(max_temp_all 65, 65 - max_temp_all, 0), CDD = ifelse(max_temp_all > 65, max_temp_all - 65, 0), Daily_Peak_Load = predict(load_model, newdata = .)) # Fill in missing predicted values for Federal Holidays load_pred$Daily_Peak_Load[load_pred$Date %in% federal_holidays$Date] Daily_Peak_Load[load_history$Date %in% federal_holidays$Date] # Merge Load Forecast, Federal Holidays, and predicted load data again load_compare merge(load_forecast, federal_holidays, by = "Date", all.x = TRUE) %>% left_join(load_pred, by = "Date") # Create a plot comparing the predicted and actual load data ggplot(load_compare, aes(Date, Daily_Peak_Load)) + geom_line(color = "blue") + geom_line(aes(y = Forecast, color = "red")) + scale_color_manual(values = c("blue", "red"), labels = c("Actual", "Forecast")) + labs(x = "Date", y = "Daily Peak Load (MWh)", title = "Actual vs. Forecasted Daily Peak Load in 2008") load_pred # Calculate the coefficient of determination (R^2) r_squared 1 - sum((load_compare$Forecast - load_compare$Daily_Peak_Load)^2) / sum((load_compare$Forecast - mean(load_compare$Forecast))^2) r_squared # Calculate the mean absolute percentage error (MAPE) mape mean(abs(load_compare$Forecast - load_compare$Daily_Peak_Load) / load_compare$Forecast) mape # Calculate the root mean squared error (RMSE) rmse sqrt(mean((load_compare$Forecast - load_compare$Daily_Peak_Load)^2)) rmse
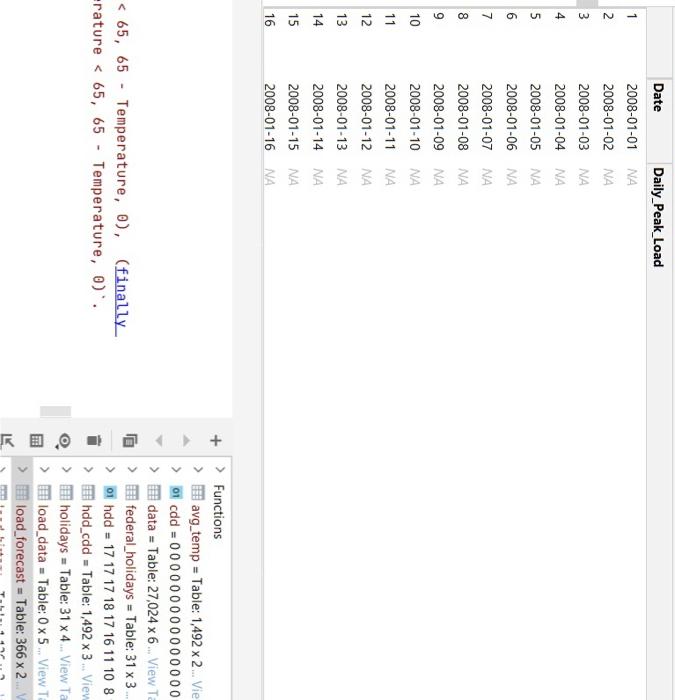
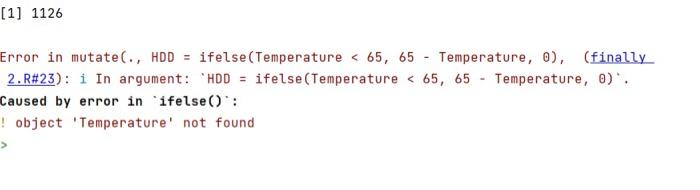
\( \begin{array}{l}\mathcal{\%}_{v}>\text { holidays }=\text { Table: } 31 \times 4 \ldots \text { View Ta } \\ \text { > load_data }=\text { Table: } 0 \times 5 . \text { View } \mathrm{T} \\ \text { >) IIIt load_forecast }=\text { Table: } 366 \times 2 \\\end{array} \) [1] 1126 Error in mutate (., HDD = ifelse(Temperature
Step by Step Solution
There are 3 Steps involved in it
1 Expert Approved Answer
Step: 1 Unlock

Question Has Been Solved by an Expert!
Get step-by-step solutions from verified subject matter experts
Step: 2 Unlock
Step: 3 Unlock