

Question: how to plot this into Rstudio using stacked barchart? the proportion of votes won by each party LD PC. SNP NA OTHER 0.15 0.26 0.29
how to plot this into Rstudio using stacked barchart?
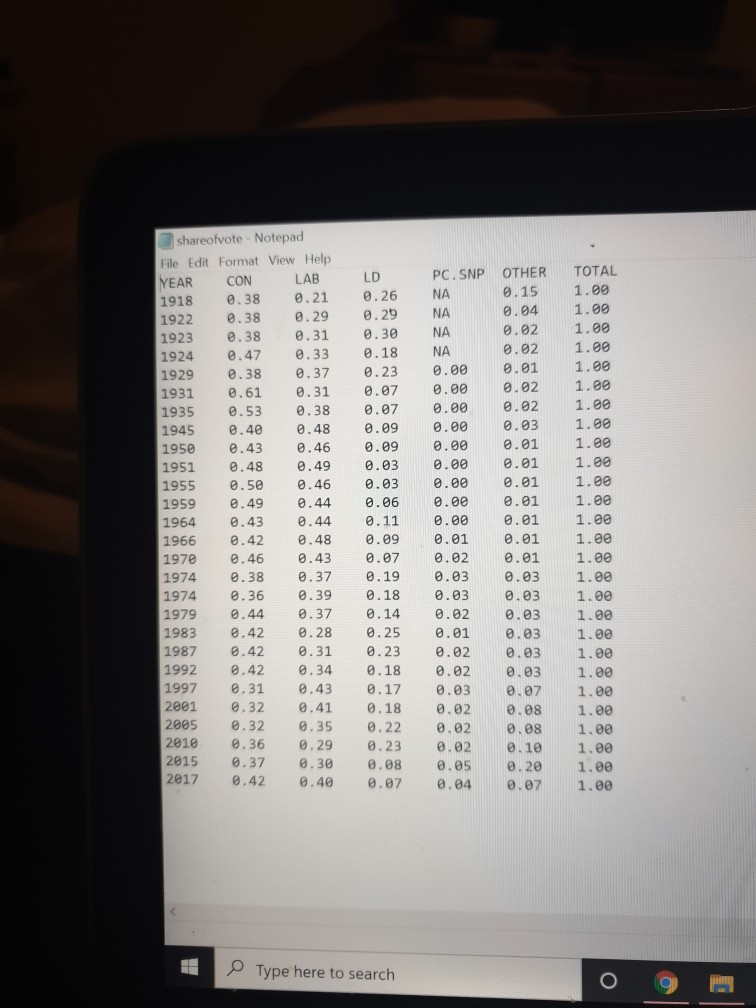
the proportion of votes won by each party
LD PC. SNP NA OTHER 0.15 0.26 0.29 0.30 0.18 0.04 0.02 NA NA 0.23 0.07 0.07 shareofvote - Notepad File Edit Format View Help YEAR CON LAB 1918 0.38 0.21 1922 0.38 0.29 1923 0.38 0.31 1924 0.47 0.33 1929 0.38 0.37 1931 0.61 0.31 1935 0.53 0.38 1945 0.40 0.48 1950 0.43 0.46 1951 0.48 0.49 1955 0.50 0.46 1959 0.49 0.44 1964 0.43 0.44 1966 0.42 0.48 1970 0.46 0.43 1974 0.38 0.37 1974 0.36 0.39 1979 0.44 0.37 1983 0.42 0.28 1987 0.42 0.31 1992 0.42 0.34 1997 0.31 0.43 2001 0.32 0.41 2005 0.32 0.35 2010 0.36 0.29 2015 0.37 0.30 2017 0.42 0.40 0.09 0.09 0.03 0.03 0.06 0.11 0.09 0.07 0.19 0.18 0.14 0.25 0.23 0.18 0.17 0.18 0.22 0.23 0.08 0.07 0.00 0.00 0.00 0.00 0.00 0.01 0.02 0.03 0.03 0.02 0.01 0.02 0.01 0.01 0.01 0.01 0.01 0.01 0.01 0.03 0.03 0.03 0.03 0.03 TOTAL 1.00 1.00 1.00 1.00 1.90 1.00 1.00 1.00 1.00 1.00 1.00 1.00 1.00 1.00 1.00 1.00 1.00 .00 1.00 1.00 1 0.02 0.08 1.00 0.85 0.04 Type here to search
Step by Step Solution
There are 3 Steps involved in it

Get step-by-step solutions from verified subject matter experts