

Question: how we can fill those information for Procter & Gamble and anlyse them? If you do not have the regression option in excel, make sure
how we can fill those information for Procter & Gamble and anlyse them?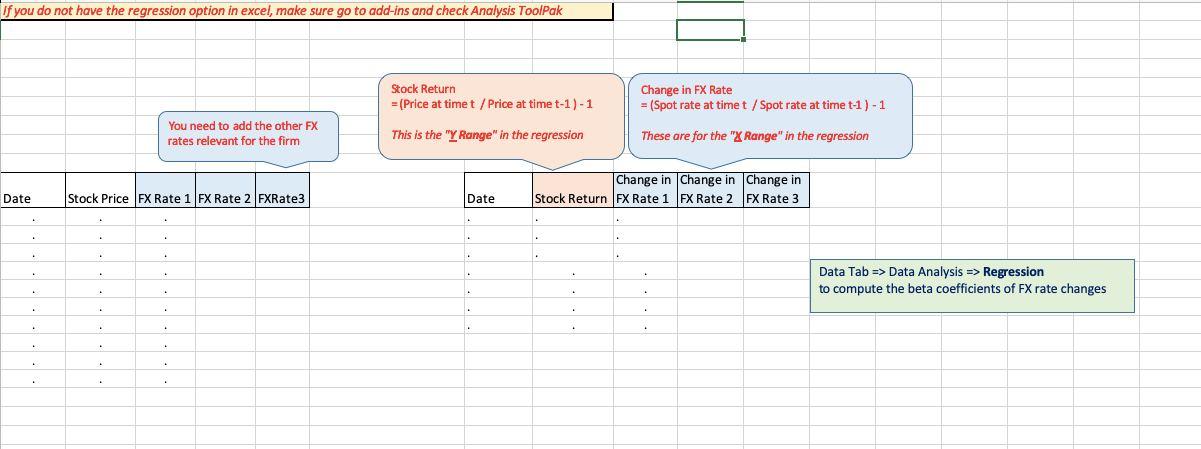
If you do not have the regression option in excel, make sure go to add-ins and check Analysis ToolPak Stock Return = (Price at timet / Price at time t-1)-1 Change in FX Rate = (Spot rate at time t / Spot rate at time t-1 ) - 1 You need to add the other FX rates relevant for the firm This is the "Y Range" in the regression These are for the "Range" in the regression Change in Change in Change in Stock Return FX Rate 1 FX Rate 2 FX Rate 3 Date Stock Price FX Rate 1 FX Rate 2 FXRate3 Date Data Tab => Data Analysis => Regression to compute the beta coefficients of FX rate changes
Step by Step Solution
There are 3 Steps involved in it

Get step-by-step solutions from verified subject matter experts