

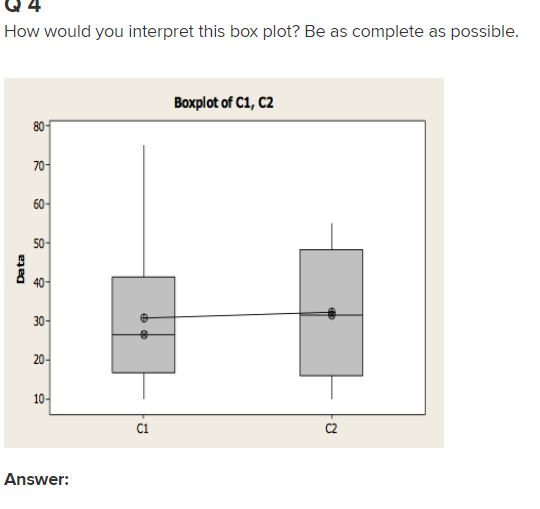
Question: How would you interpret this box plot? Be as complete as possible. Boxplot of C1, C2 80- 70- 60- 50- 40 Data 30- 20- 10-
Step by Step Solution
There are 3 Steps involved in it
1 Expert Approved Answer
Step: 1 Unlock

Question Has Been Solved by an Expert!
Get step-by-step solutions from verified subject matter experts
Step: 2 Unlock
Step: 3 Unlock