

Question: 1. Start the pump following the standard procedure detailed in the manual. 2. Adjust the pump flow using the brench regulating valve. 3. Use
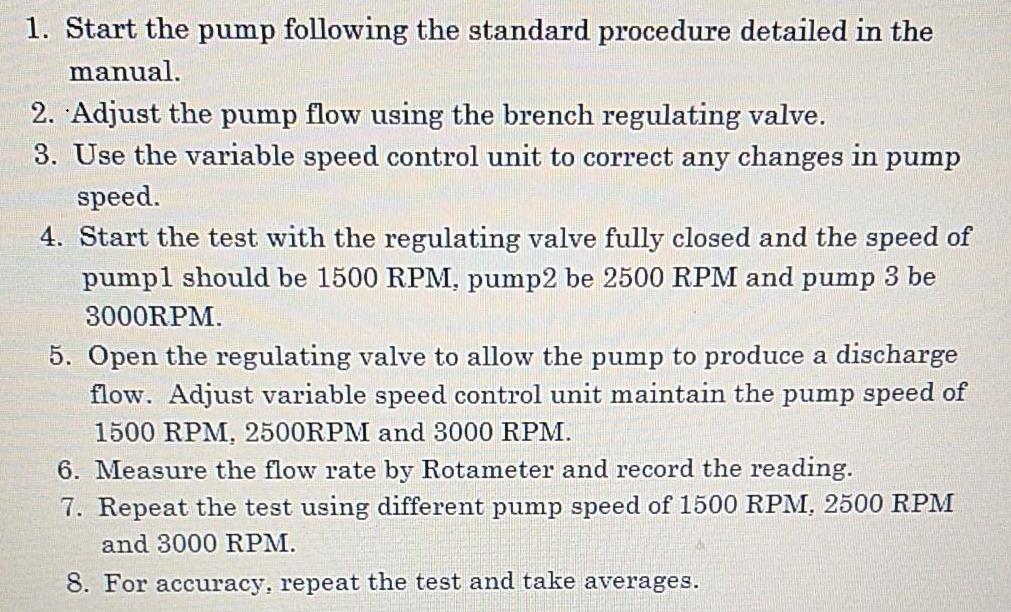
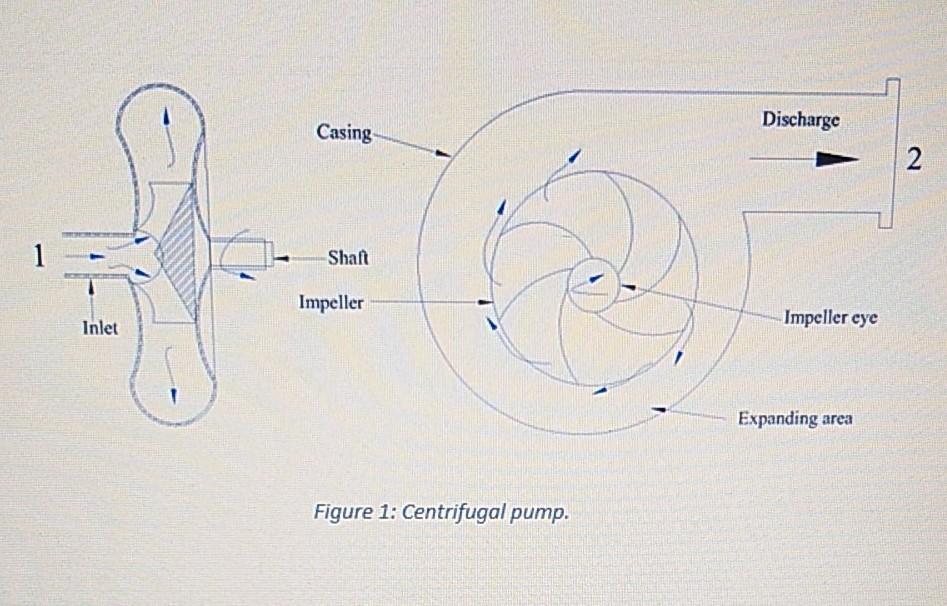
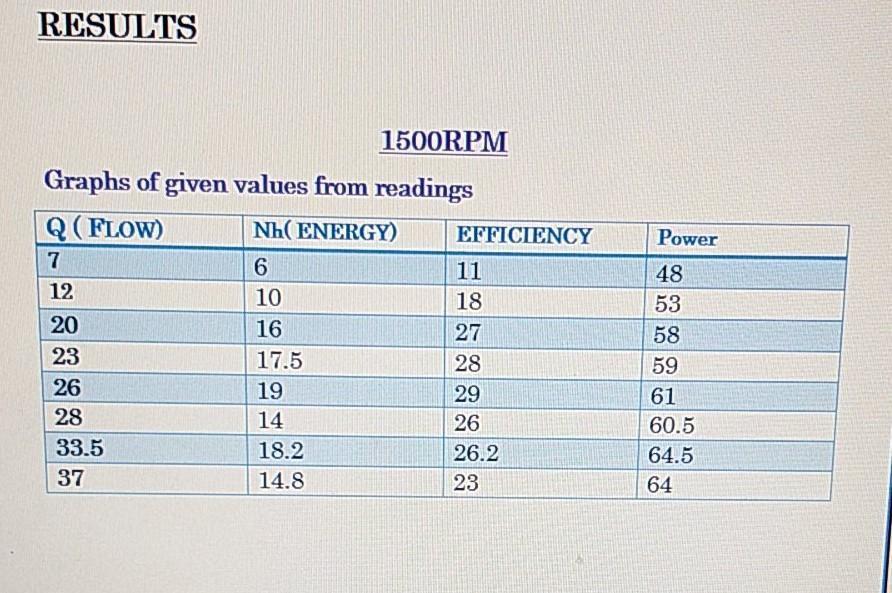
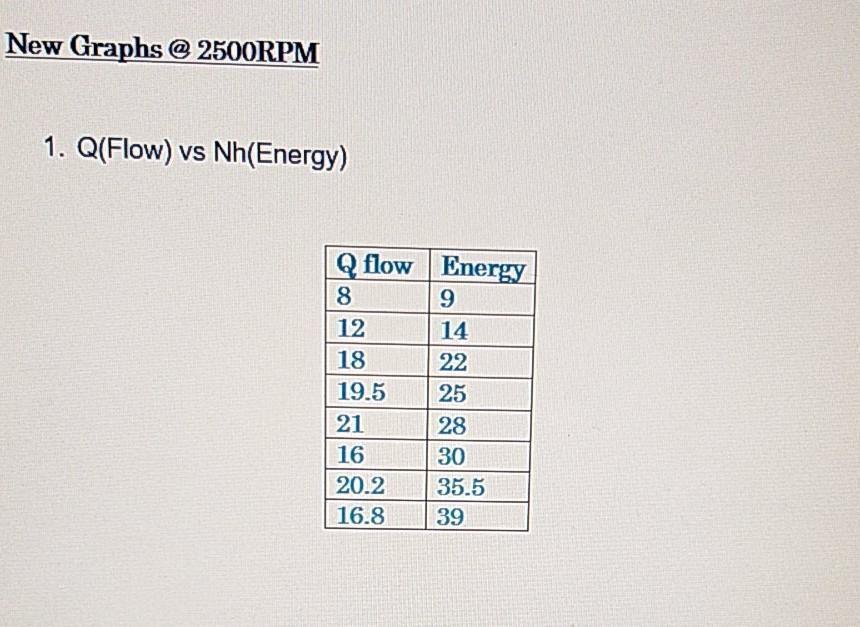
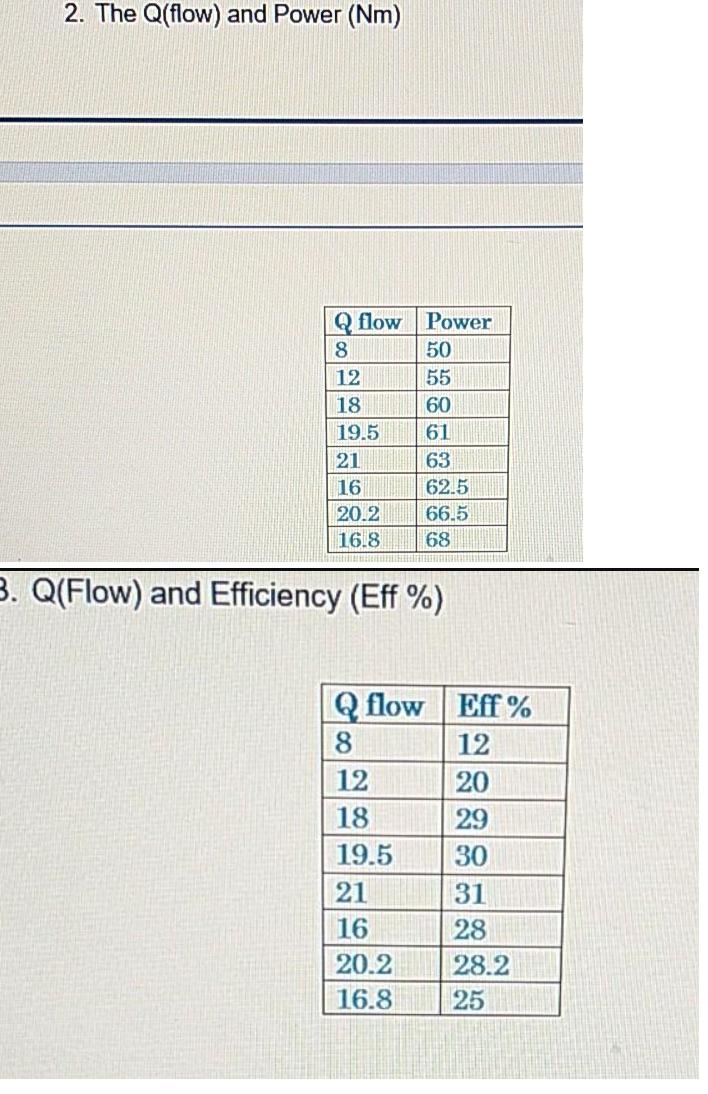
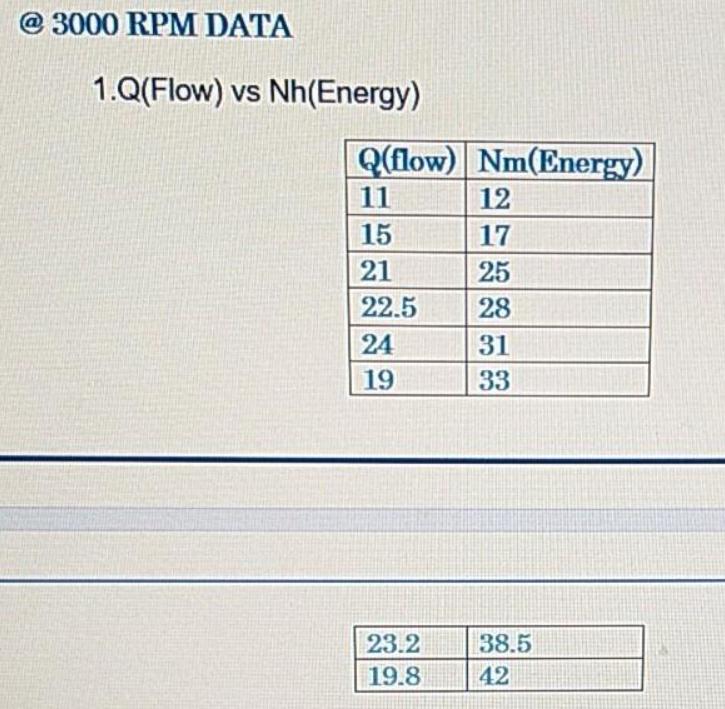
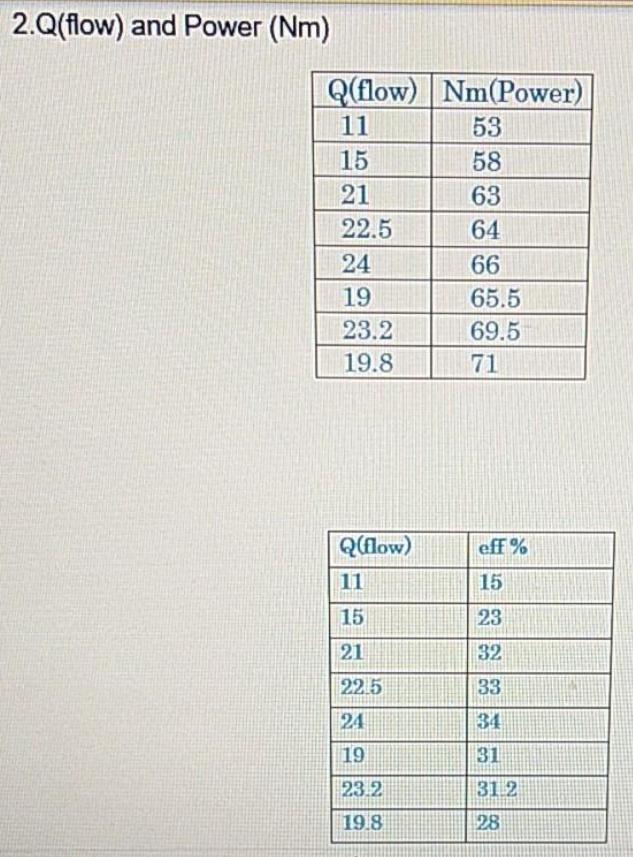

1. Start the pump following the standard procedure detailed in the manual. 2. Adjust the pump flow using the brench regulating valve. 3. Use the variable speed control unit to correct any changes in pump speed. 4. Start the test with the regulating valve fully closed and the speed of pumpl should be 1500 RPM. pump2 be 2500 RPM and pump 3 be 3000RPM. 5. Open the regulating valve to allow the pump to produce a discharge flow. Adjust variable speed control unit maintain the pump speed of 1500 RPM, 2500RPM and 3000 RPM. 6. Measure the flow rate by Rotameter and record the reading. 7. Repeat the test using different pump speed of 1500 RPM, 2500 RPM and 3000 RPM. 8. For accuracy, repeat the test and take averages. Discharge Casing 1 Shaft Impeller Inlet Impeller eye Expanding area Figure 1: Centrifugal pump. RESULTS 1500RPM Graphs of given values from readings Q(FLOW) Nh( ENERGY) EFFICIENCY Power 7 6. 11 48 12 10 18 53 20 16 27 58 23 17.5 28 59 26 19 29 61 28 14 26 60.5 33.5 18.2 26.2 64.5 37 14.8 23 64 New Graphs @ 2500RPM 1. Q(Flow) vs Nh(Energy) Q flow Energy 9. 8 12 14 18 22 19.5 25 21 28 16 30 20.2 35.5 16.8 39 2. The Q(flow) and Power (Nm) Q flow Power 8 50 12 55 18 60 19.5 61 21 63 16 62.5 20.2 66.5 16.8 68 3. Q(Flow) and Efficiency (Eff %) Q flow Eff % 8 12 12 20 18 29 19.5 30 21 31 16 28 20.2 28.2 16.8 25 @ 3000 RPM DATA 1.Q(Flow) vs Nh(Energy) Q(flow) Nm(Energy) 11 12 15 17 21 25 22.5 28 24 31 19 33 23.2 38.5 19.8 42 2.Q(flow) and Power (Nm) Q(flow) Nm(Power) 11 53 15 58 21 63 22.5 64 24 66 19 65.5 23.2 69.5 19.8 71 Q(low) eff % 11 15 15 23 21 32 22.5 33 24 34 19 31 23.2 31 2 19.8 28 1.Compile a report for the practical with the data provided 2.Draw and explain three graphs from each RMP. 3.Draw up a cloclusion. 4.Report must be submitted one week after the practical before 16:00.
Step by Step Solution
3.41 Rating (151 Votes )
There are 3 Steps involved in it
1 At 1500 RPM Q Flow Nh Energy Efficiency PowerNm 7 6 1100 48 12 10 1800 53 20 16 2700 58 23 175 280... View full answer

Get step-by-step solutions from verified subject matter experts