

Question: Human Population Growth and Carrying Capacity Step 1- Create Human Population Growth Graph Directions: Use the following data to graph the human population starting in
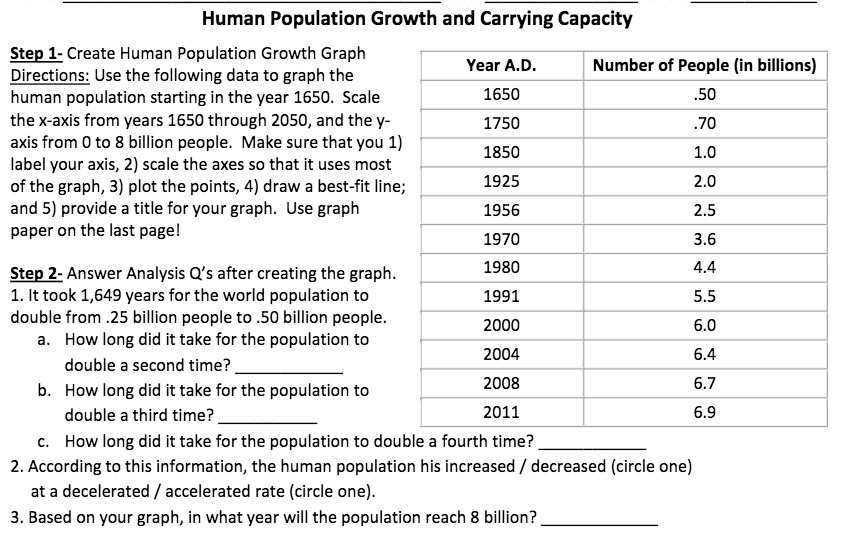
Human Population Growth and Carrying Capacity Step 1- Create Human Population Growth Graph Directions: Use the following data to graph the human population starting in the year 1550. Scale the xaxis from years 1550 through 2050, and the y- axis from D to 8 billion people. Make sure that you 1} label your axis, 2} scale the axes so that it uses most of the graph, 3) plot the points, 4) draw a best-t line; and 5} provide a title for your graph. Use graph paper on the last page! Step 2- Answer Analysis [1's after creating the graph. 1. it took 1,549 years for the world population to double from .25 billion people to .50 billion people. a. How long did it take for the population to double a second time? b. How long did it take for the population to double a third time? Number of People {in billions 1925 1955 1920 1980 1991 2000 2004 5.4 2003 5.? 2011 5.9 5.0 c. How long did it take for the population to double a fourth time? 2. According to this information, the human population his increased I decreased [circle one} at a decelerated f accelerated rate [circle one]. 3. Based on your graph, in what year will the population reach 3 billion
Step by Step Solution
There are 3 Steps involved in it

Get step-by-step solutions from verified subject matter experts