

Question: I already know the answer was C. But I need to know how to get the return migrants were positively selected from this graph. And
I already know the answer was C. But I need to know how to get the return migrants were positively selected from this graph. And what are the panel and Repeated cross-section stand for in this graph? I prefer examples in the explanation.
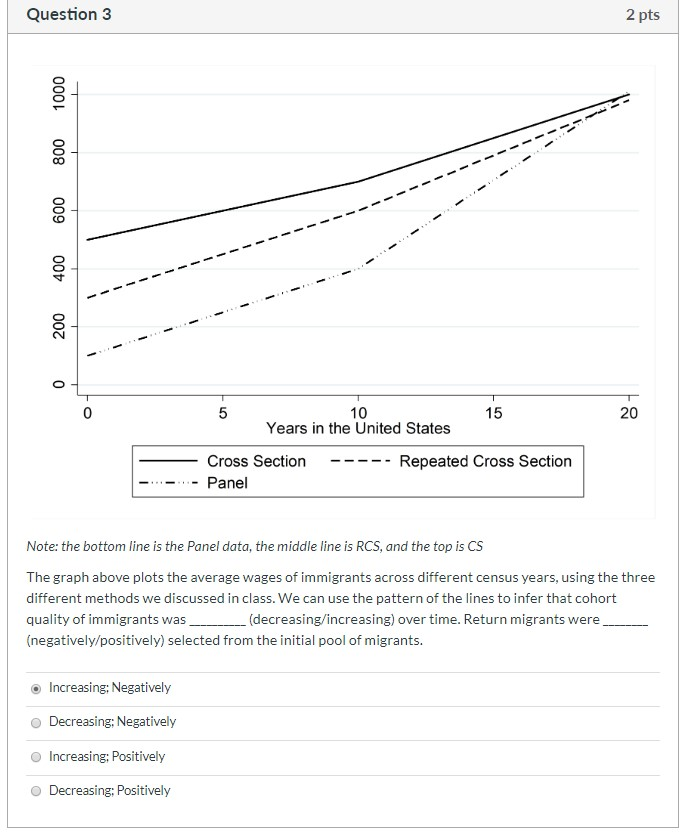
Question 3 2 pts 1000 800 600 400 200 O 5 10 Years in the United States Cross Section - Panel ----- Repeated Cross Section Note: the bottom line is the Panel data, the middle line is RCS, and the top is CS The graph above plots the average wages of immigrants across different census years, using the three different methods we discussed in class. We can use the pattern of the lines to infer that cohort quality of immigrants was _______ (decreasing/increasing) over time. Return migrants were (negatively/positively) selected from the initial pool of migrants. Increasing: Negatively Decreasing: Negatively Increasing: Positively Decreasing: Positively Question 3 2 pts 1000 800 600 400 200 O 5 10 Years in the United States Cross Section - Panel ----- Repeated Cross Section Note: the bottom line is the Panel data, the middle line is RCS, and the top is CS The graph above plots the average wages of immigrants across different census years, using the three different methods we discussed in class. We can use the pattern of the lines to infer that cohort quality of immigrants was _______ (decreasing/increasing) over time. Return migrants were (negatively/positively) selected from the initial pool of migrants. Increasing: Negatively Decreasing: Negatively Increasing: Positively Decreasing: PositivelyStep by Step Solution
There are 3 Steps involved in it
1 Expert Approved Answer
Step: 1 Unlock

Question Has Been Solved by an Expert!
Get step-by-step solutions from verified subject matter experts
Step: 2 Unlock
Step: 3 Unlock