

Question: I Am having a problem with # 3. Below is the code I have written for steps 1and 2. Step 3 is below as a
I Am having a problem with # 3. Below is the code I have written for steps 1and 2. Step 3 is below as a jpeg. This is for RStudio > data df colnames(df) df df$median df$mean df$population install.packages("zipcode") > data("zipcode") > df$zip mzip mzip income states mestin pop states statepop meinstpop match(meinstpop$states,state.abb) > mapIncome mapIncome mapIncome mapIncome mapIncome mapPop mapPop mapPop mapPop mapPop mapPop 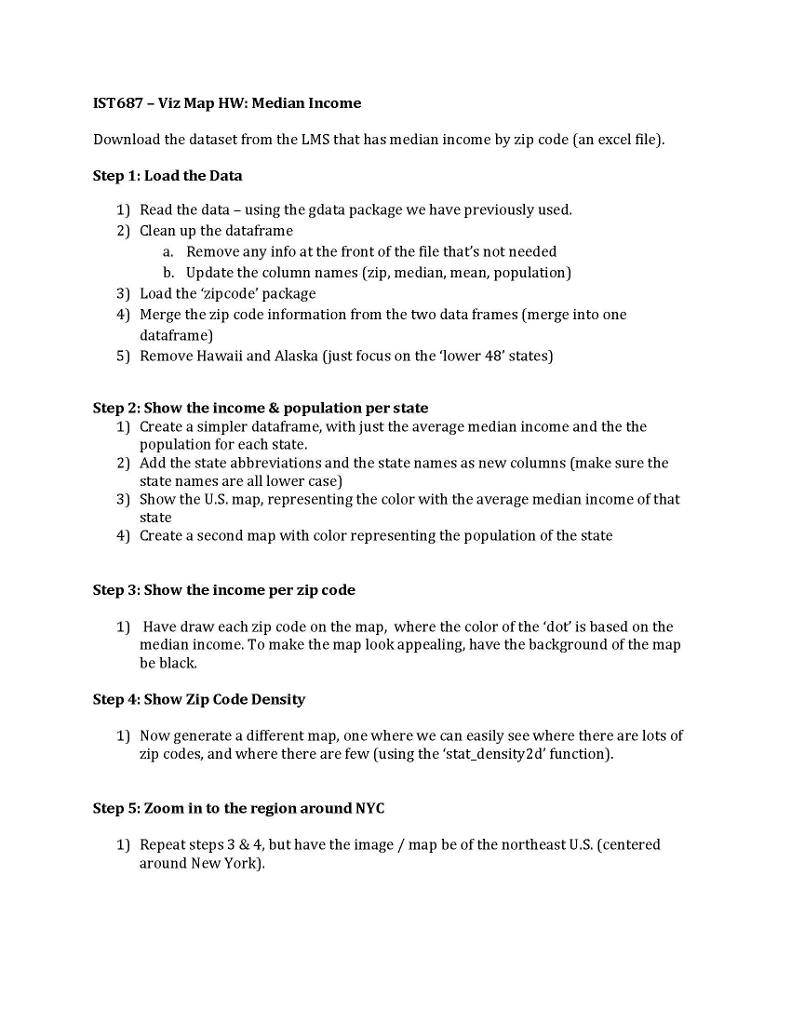
IST687 -Viz Map HW: Median Income Download the dataset from the LMS that has median income by zip code (an excel file) Step 1: Load the Data 1) Read the data using the gdata package we have previously used. 2) Clean up the dataframe a. Remove any info at the front of the file that's not needed b. Update the column names (zip, median, mean, population) 3) Load the 'zipcode' package 4) Merge the zip code information from the two data frames (merge into one dataframe) 5) Remove Hawaii and Alaska (just focus on the 'lower 48' states) Step 2: Show the income & population per state 1) 2) Add the state abbreviations and the state names as new columns (make sure the 3) Show the U.S. map, representing the color with the average median income of that 4) Create a second map with color representing the population of the state Create a simpler dataframe, with just the average median income and the the population for each state state names are all lower case) state Step 3: Show the income per zip code 1) Have draw each zip code on the map, where the color of the 'dot' is based on the median income. To make the map look appealing, have the background of the map be black. Step 4: Show Zip Code Density 1) Now generate a different map, one where we can easily see where there are lots of zip codes, and where there are few (using the 'stat density2d' function) Step 5: Zoom in to the region around NYC 1) Repeat steps 3 & 4, but have the image map be of the northeast U.S. (centered around New York) IST687 -Viz Map HW: Median Income Download the dataset from the LMS that has median income by zip code (an excel file) Step 1: Load the Data 1) Read the data using the gdata package we have previously used. 2) Clean up the dataframe a. Remove any info at the front of the file that's not needed b. Update the column names (zip, median, mean, population) 3) Load the 'zipcode' package 4) Merge the zip code information from the two data frames (merge into one dataframe) 5) Remove Hawaii and Alaska (just focus on the 'lower 48' states) Step 2: Show the income & population per state 1) 2) Add the state abbreviations and the state names as new columns (make sure the 3) Show the U.S. map, representing the color with the average median income of that 4) Create a second map with color representing the population of the state Create a simpler dataframe, with just the average median income and the the population for each state state names are all lower case) state Step 3: Show the income per zip code 1) Have draw each zip code on the map, where the color of the 'dot' is based on the median income. To make the map look appealing, have the background of the map be black. Step 4: Show Zip Code Density 1) Now generate a different map, one where we can easily see where there are lots of zip codes, and where there are few (using the 'stat density2d' function) Step 5: Zoom in to the region around NYC 1) Repeat steps 3 & 4, but have the image map be of the northeast U.S. (centered around New York)
Step by Step Solution
There are 3 Steps involved in it

Get step-by-step solutions from verified subject matter experts