Question: I am having trouble getting these solutions in excel, help solving them in excel is needed. Content X Airbnb Question X Bb Signature Inval X
I am having trouble getting these solutions in excel, help solving them in excel is needed.
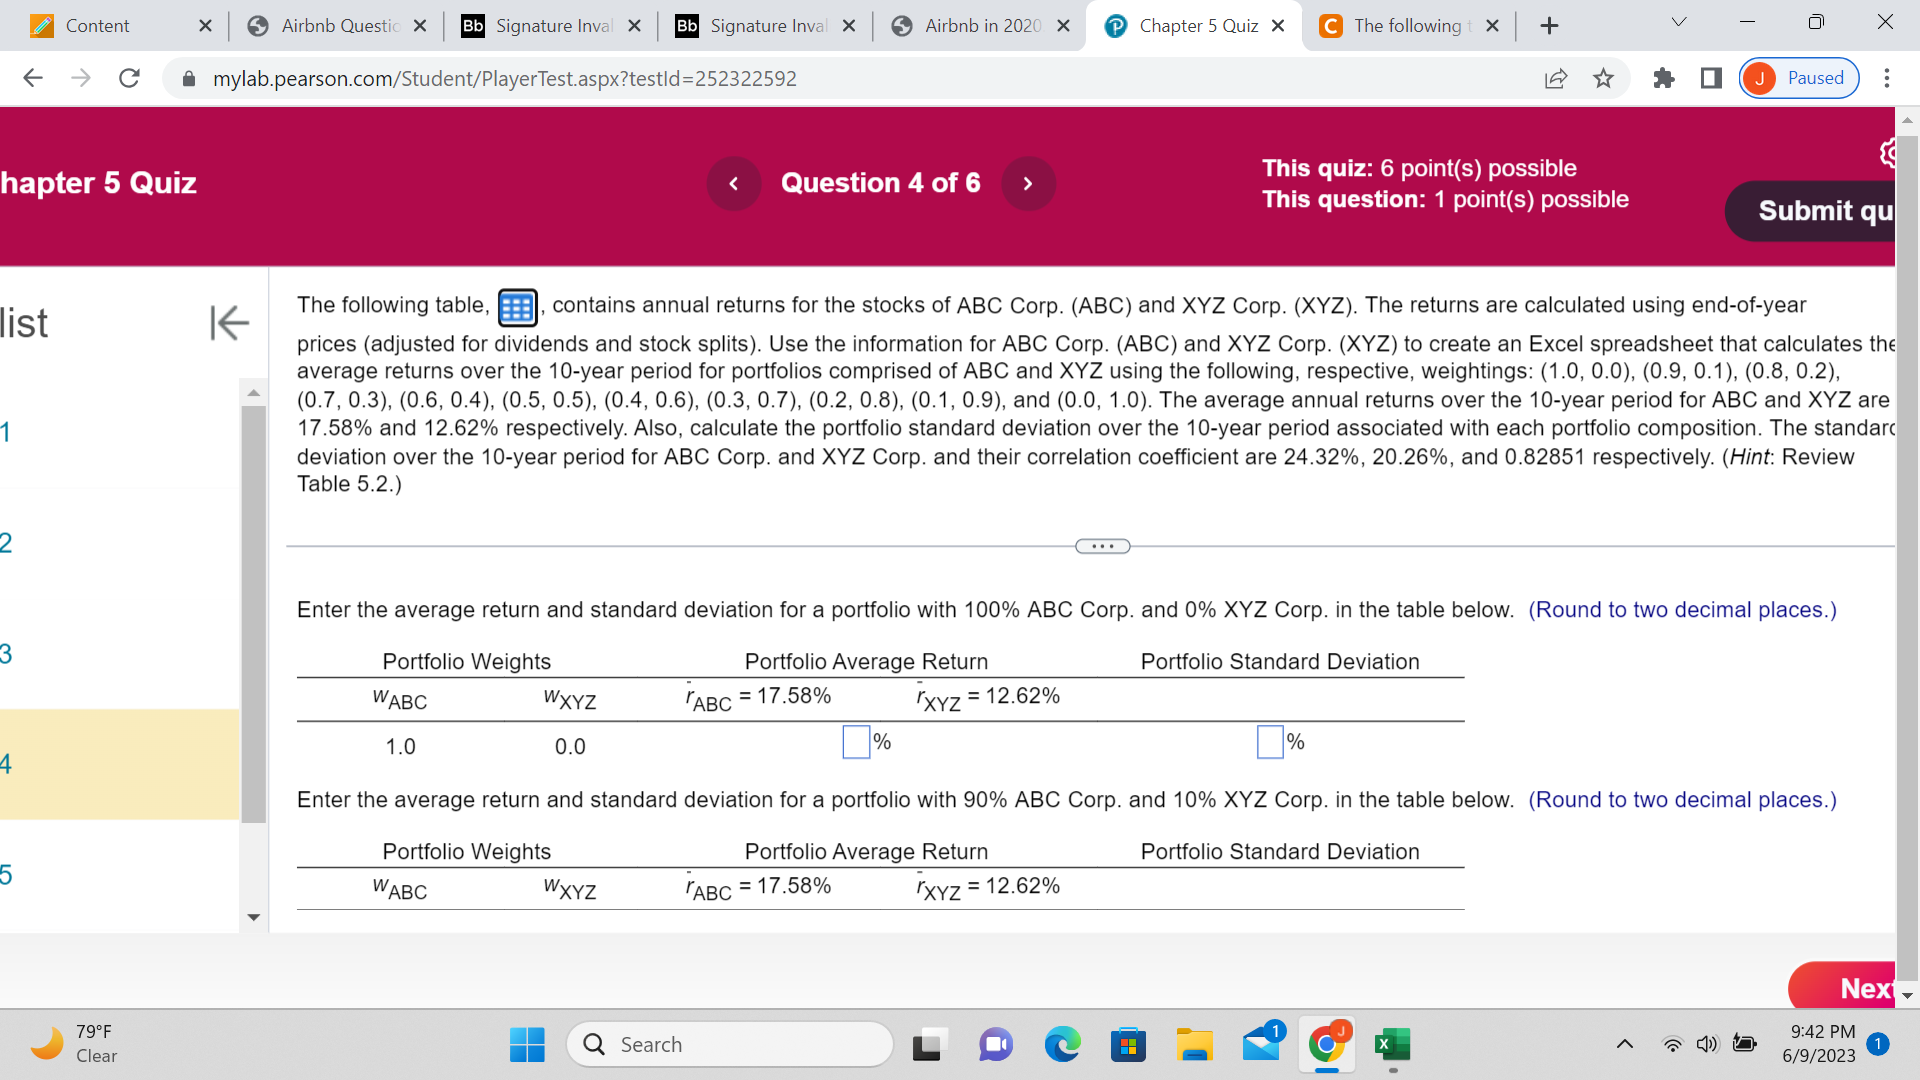
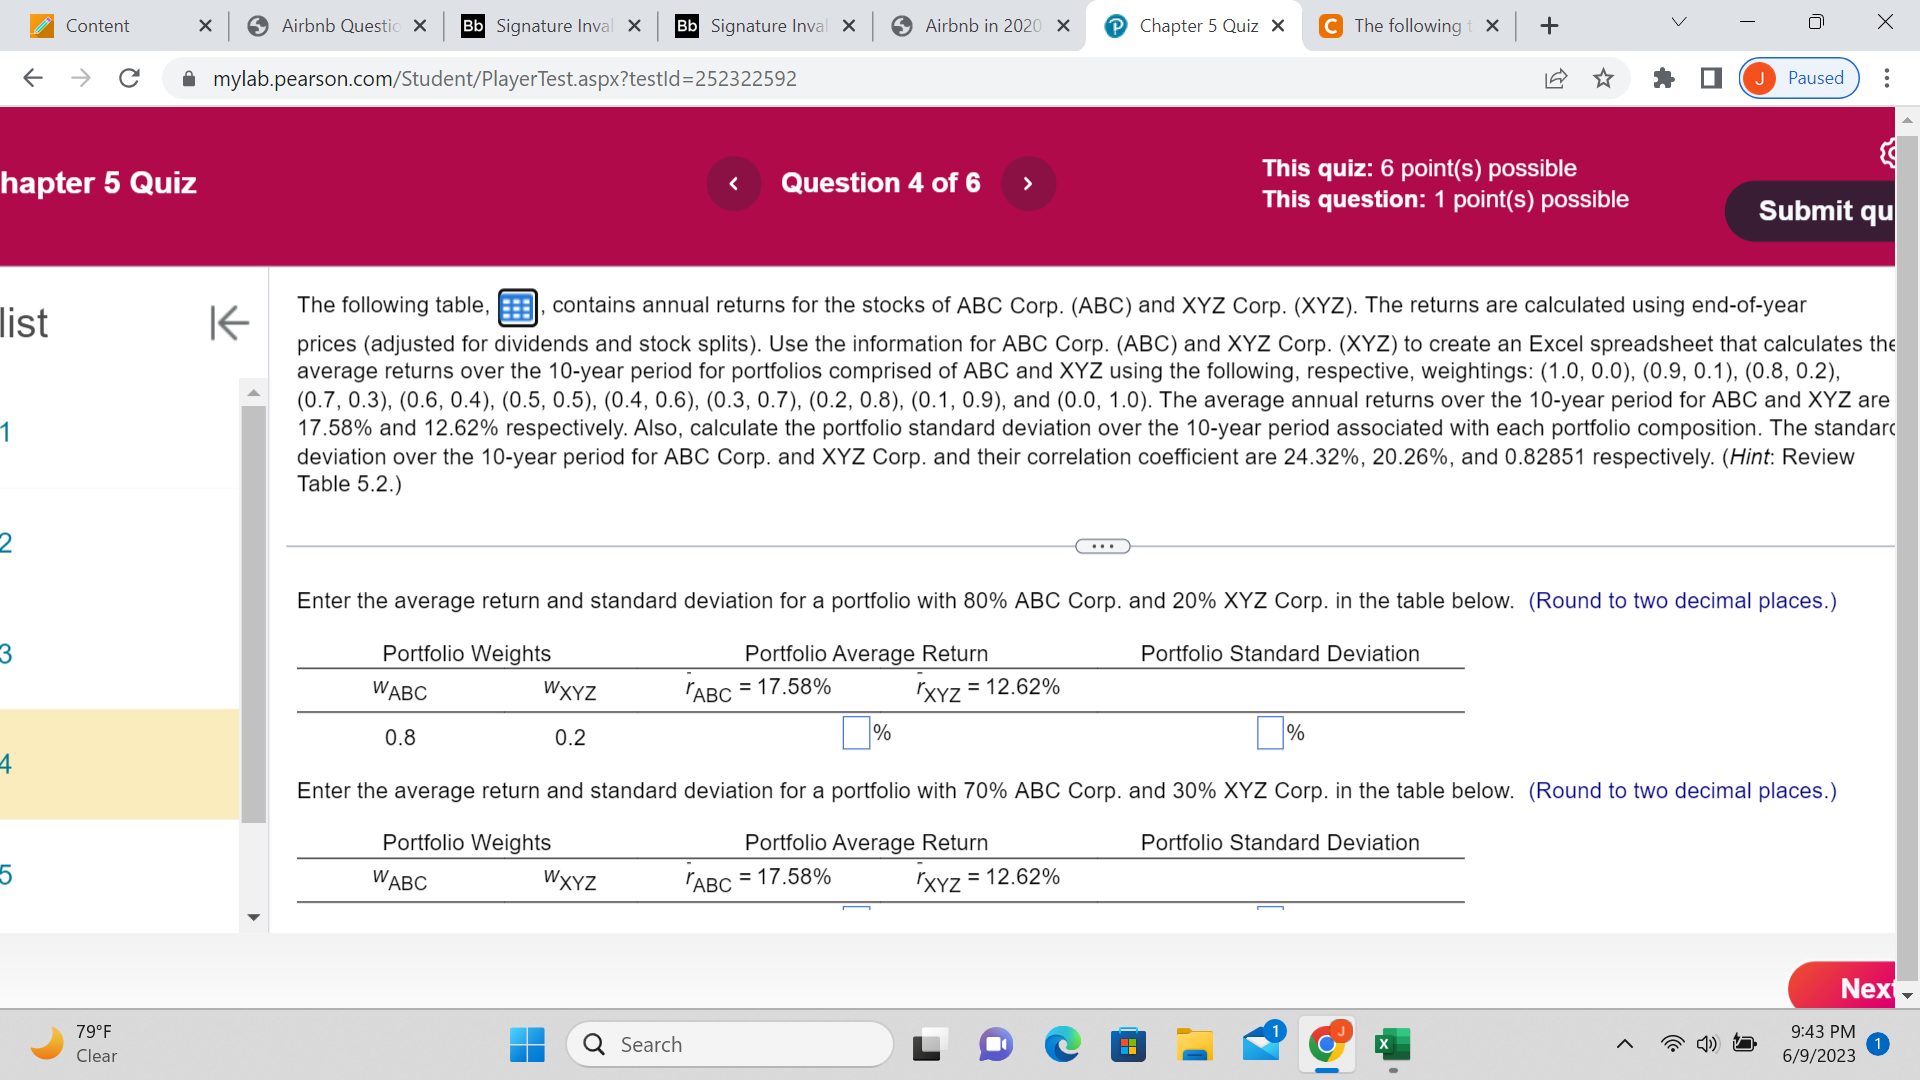
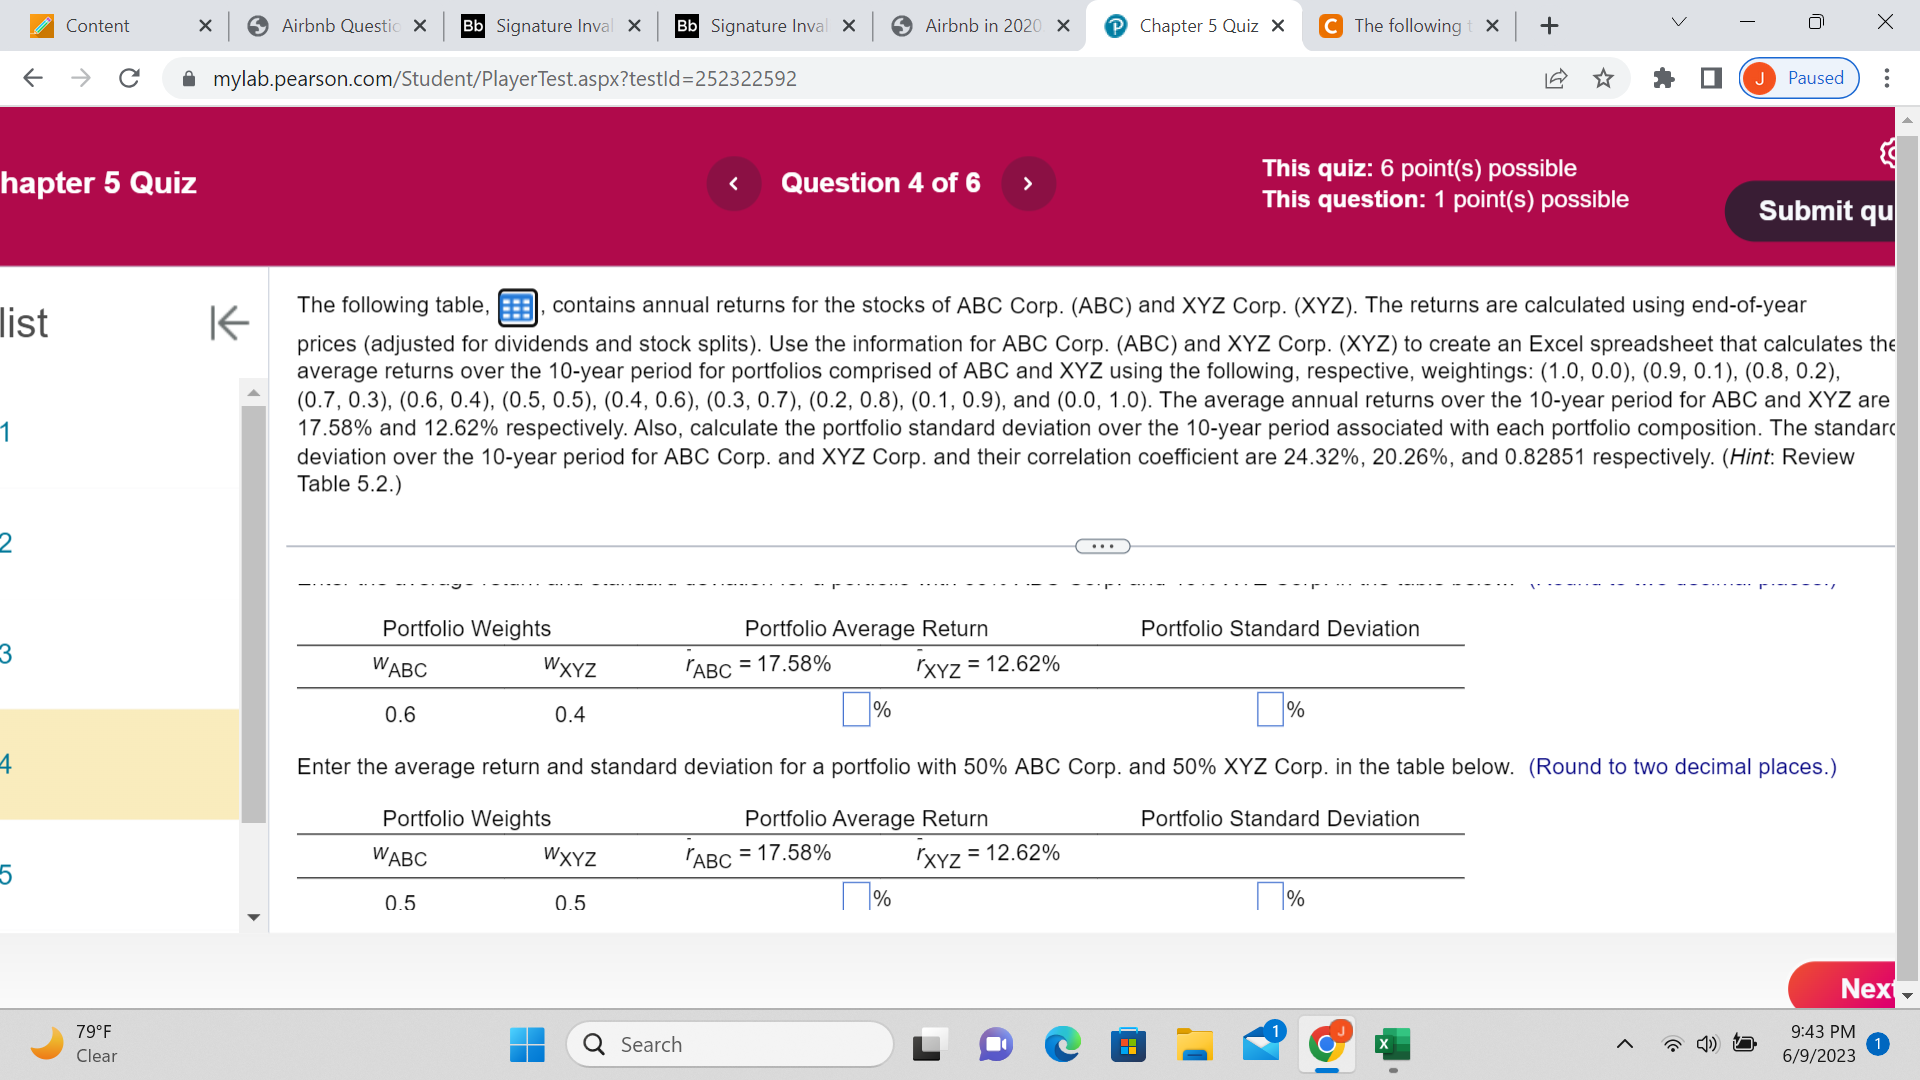
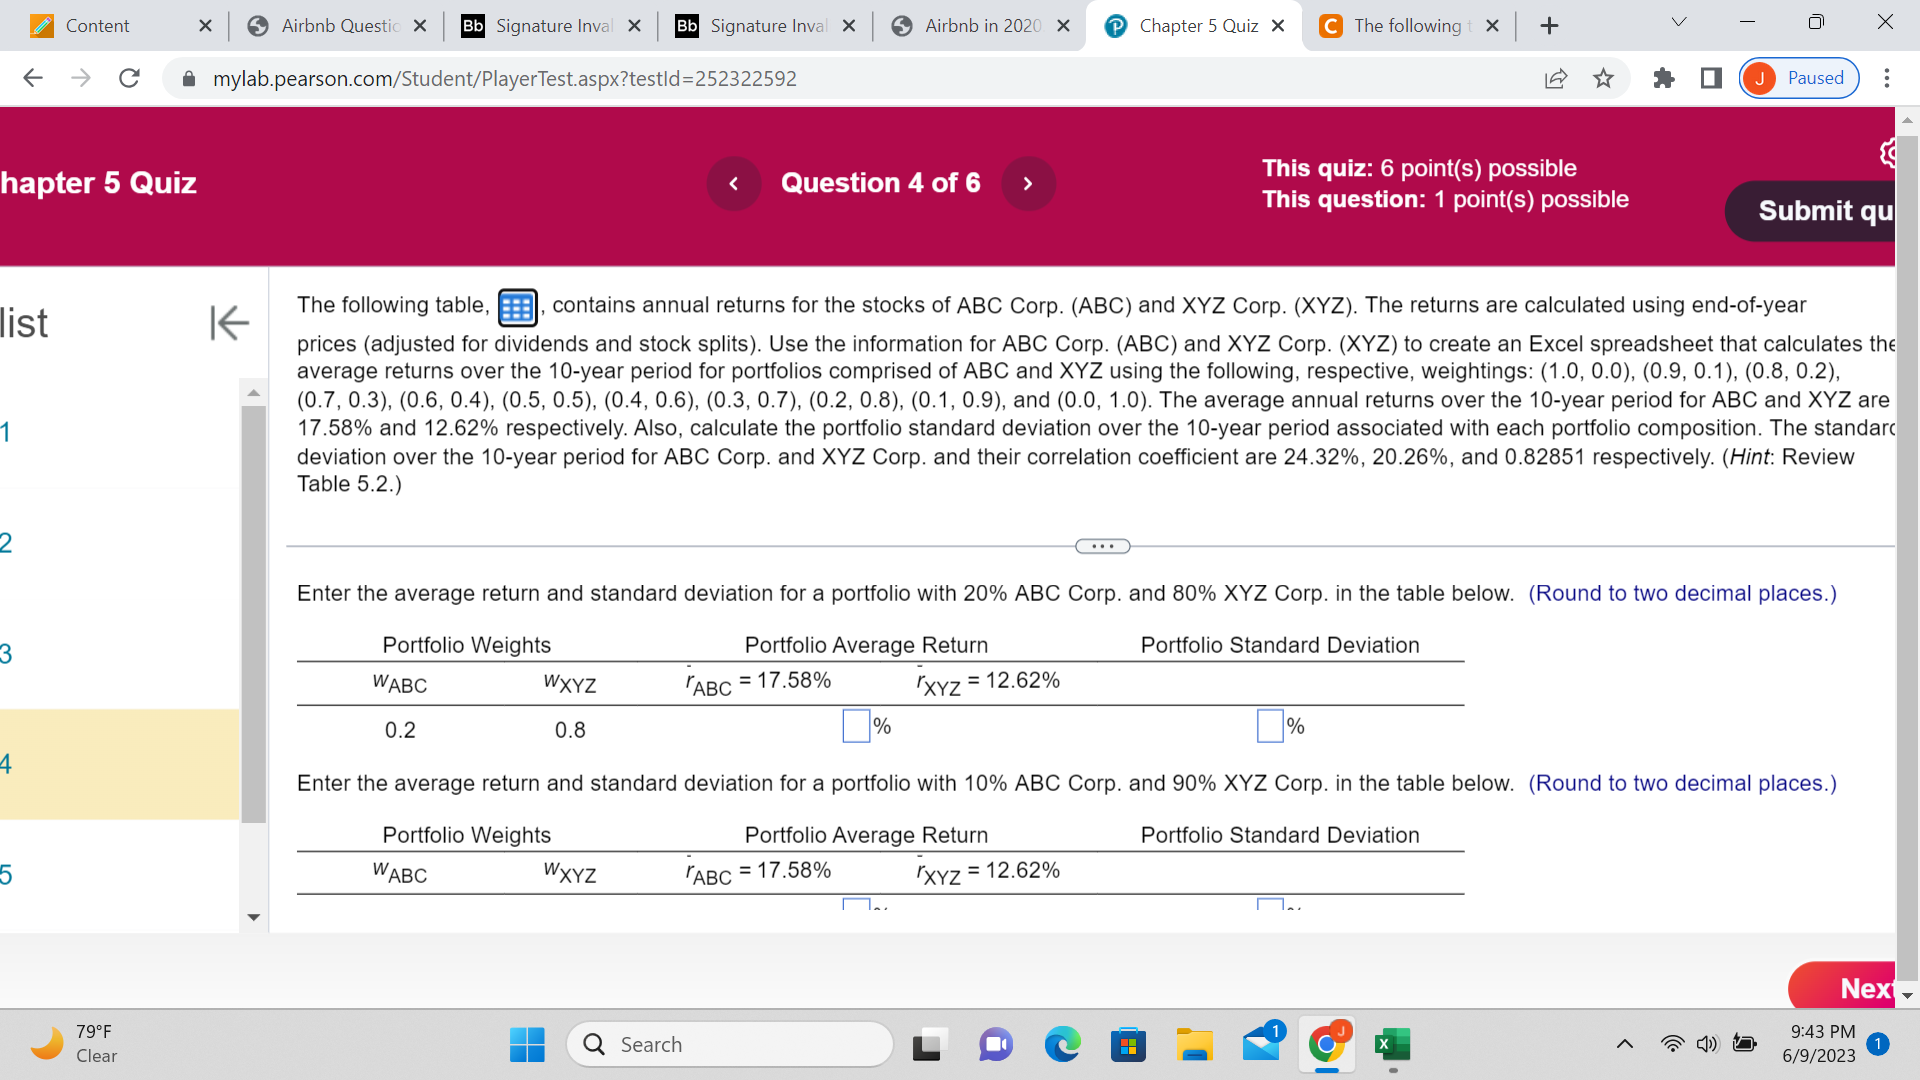
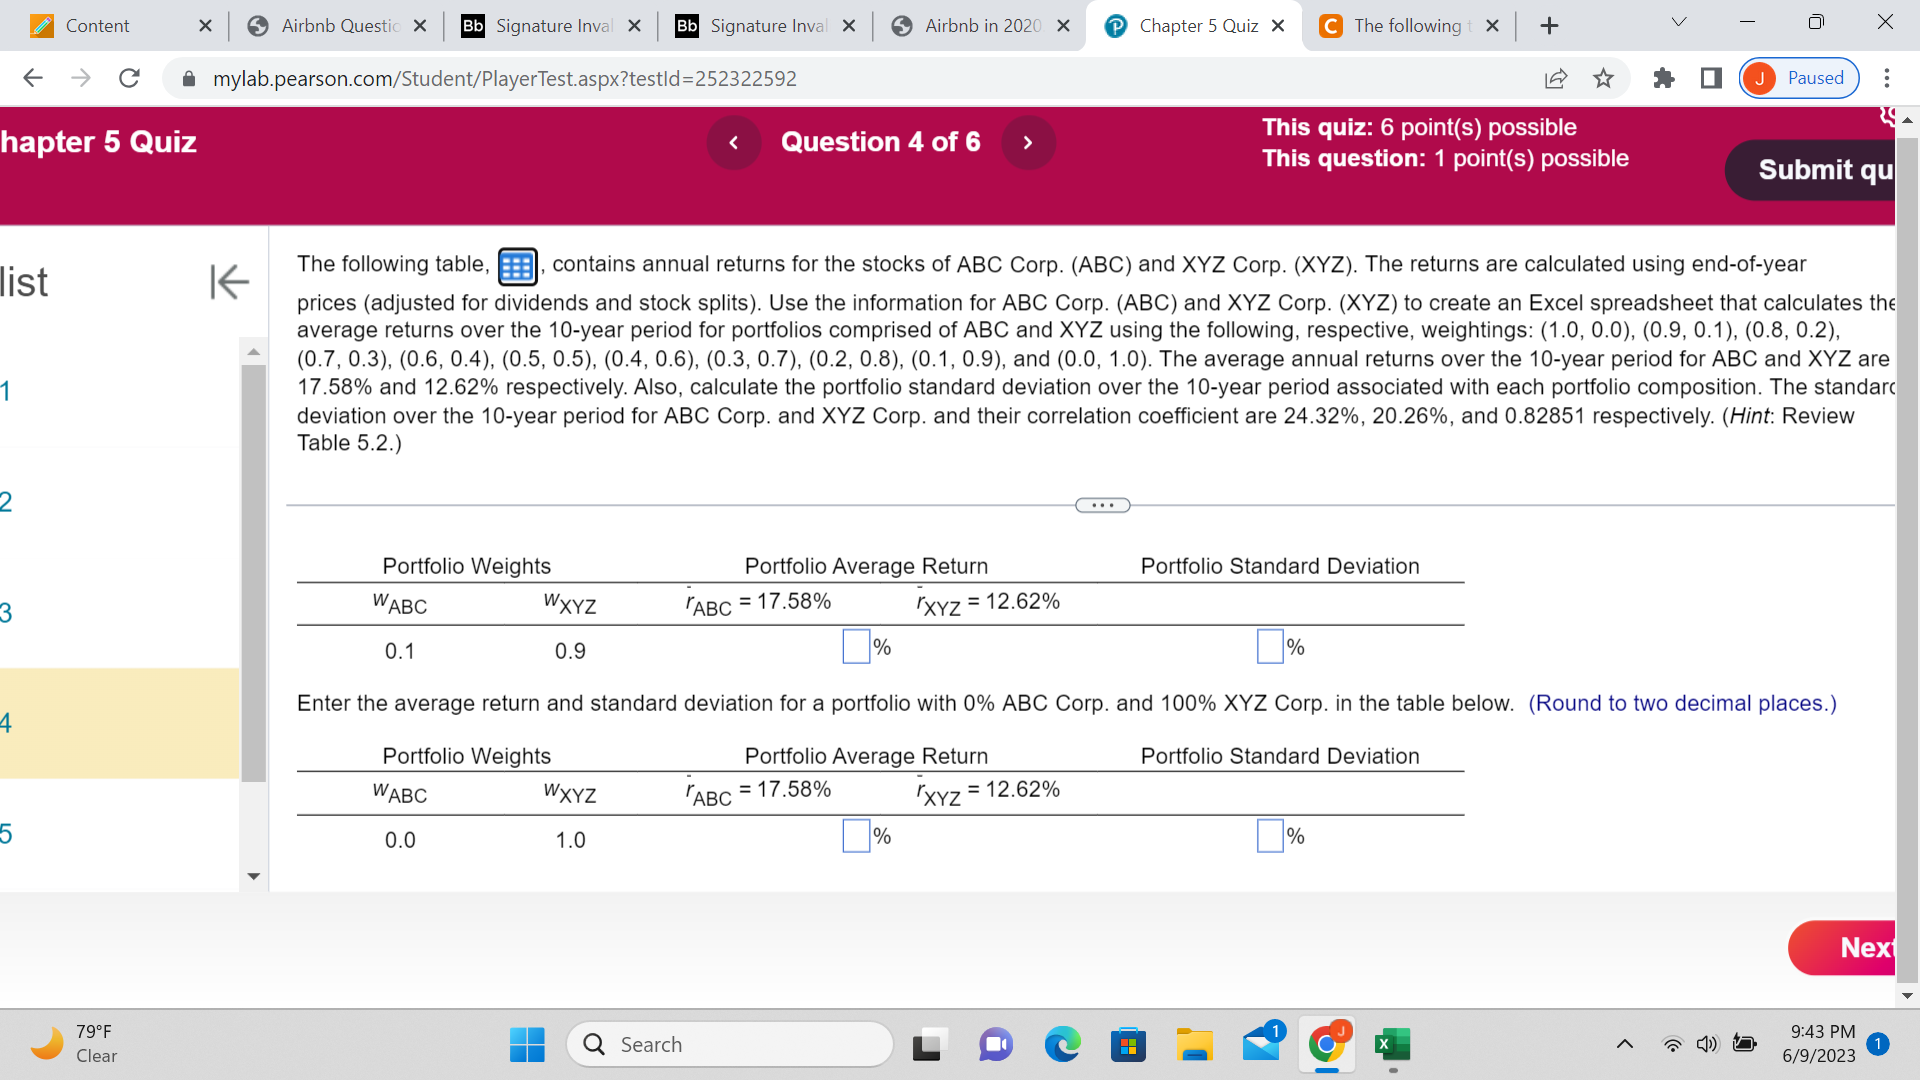
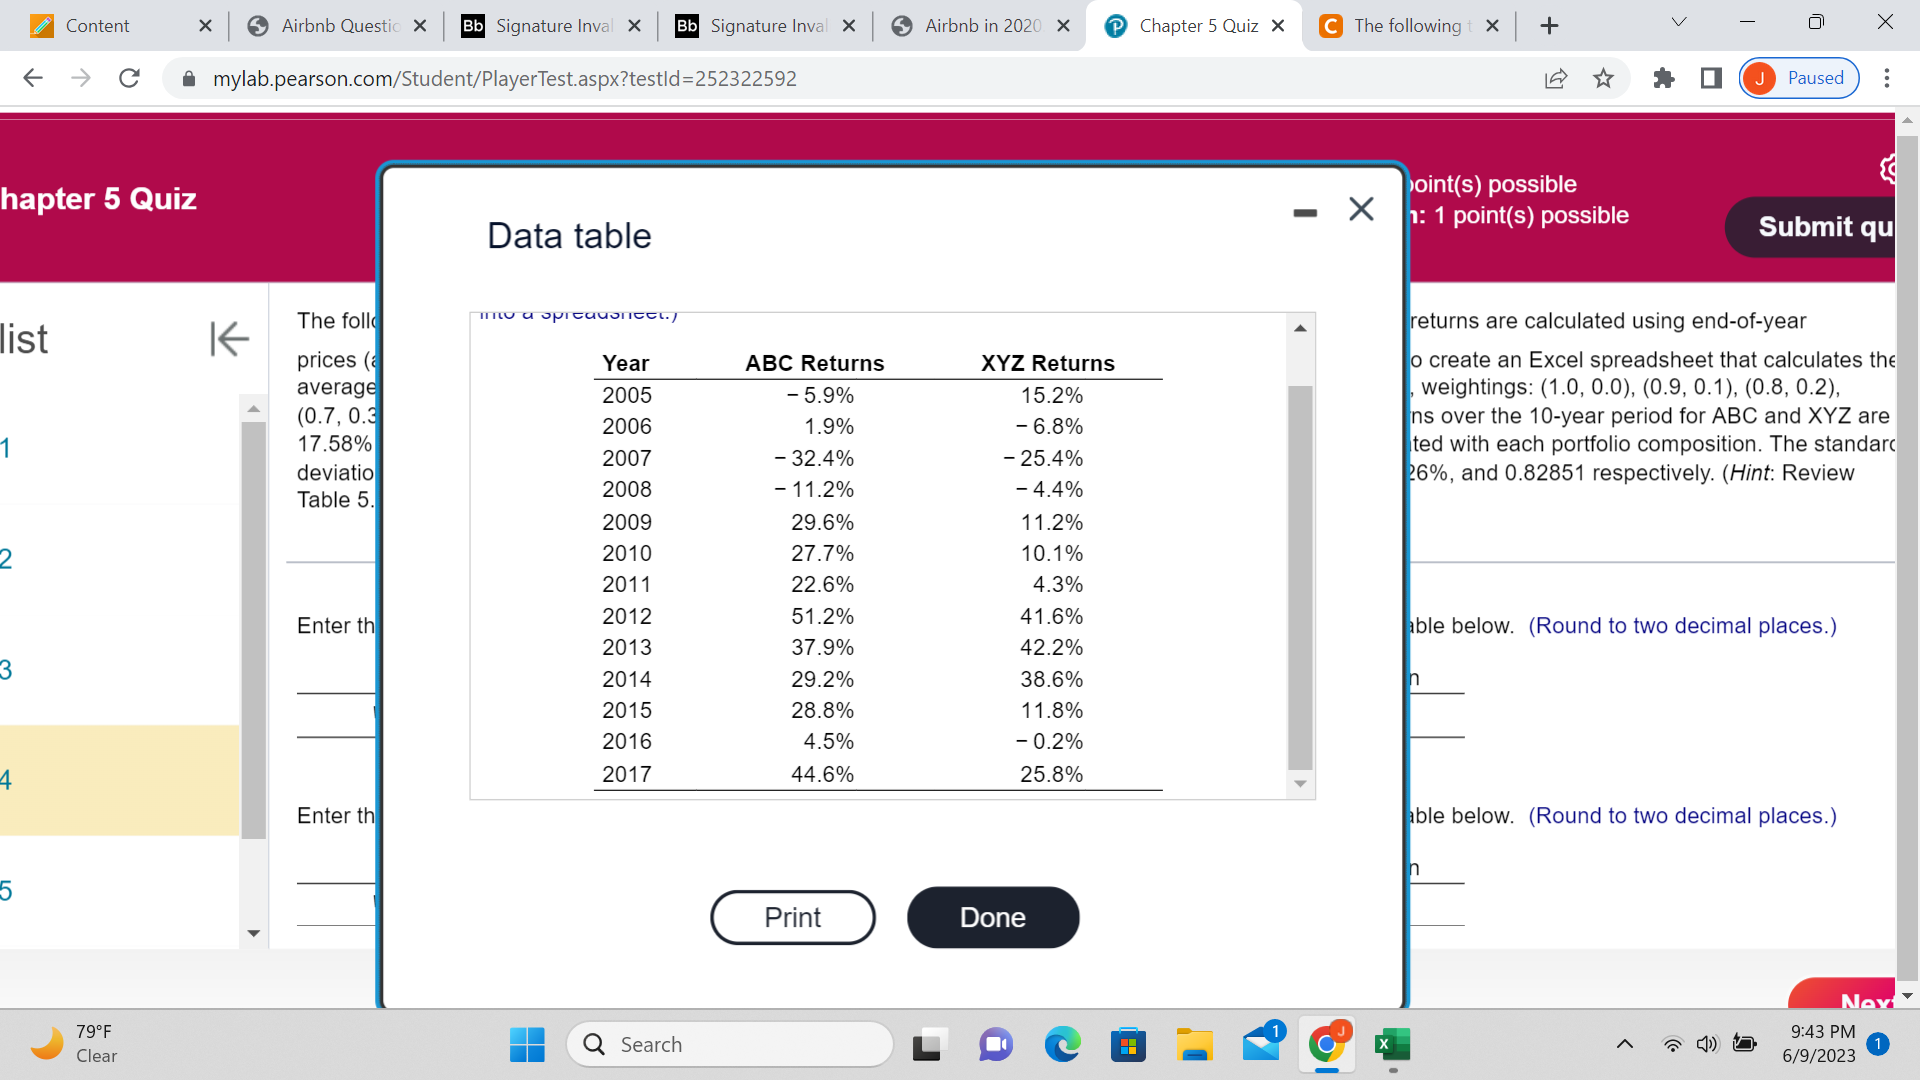
Content X Airbnb Question X Bb Signature Inval X Bb Signature Inval X Airbnb in 2020 X Chapter 5 Quiz X C The following t X + V X -> C A mylab.pearson.com/Student/PlayerTest.aspx?testld=252322592 J Paused . . . hapter 5 Quiz Question 4 of 6 This quiz: 6 point(s) possible This question: 1 point(s) possible Submit qu list K The following table, , contains annual returns for the stocks of ABC Corp. (ABC) and XYZ Corp. (XYZ). The returns are calculated using end-of-year prices (adjusted for dividends and stock splits). Use the information for ABC Corp. (ABC) and XYZ Corp. (XYZ) to create an Excel spreadsheet that calculates the average returns over the 10-year period for portfolios comprised of ABC and XYZ using the following, respective, weightings: (1.0, 0.0), (0.9, 0.1), (0.8, 0.2), (0.7, 0.3), (0.6, 0.4), (0.5, 0.5), (0.4, 0.6), (0.3, 0.7), (0.2, 0.8), (0.1, 0.9), and (0.0, 1.0). The average annual returns over the 10-year period for ABC and XYZ are 17.58% and 12.62% respectively. Also, calculate the portfolio standard deviation over the 10-year period associated with each portfolio composition. The standard deviation over the 10-year period for ABC Corp. and XYZ Corp. and their correlation coefficient are 24.32%, 20.26%, and 0.82851 respectively. (Hint: Review Table 5.2.) Enter the average return and standard deviation for a portfolio with 100% ABC Corp. and 0% XYZ Corp. in the table below. (Round to two decimal places.) Portfolio Weights Portfolio Average Return Portfolio Standard Deviation WABC WXYZ ABC = 17.58% XYZ = 12.62% 1.0 0.0 % % Enter the average return and standard deviation for a portfolio with 90% ABC Corp. and 10% XYZ Corp. in the table below. (Round to two decimal places.) Portfolio Weights Portfolio Average Return Portfolio Standard Deviation WABC WXYZ ABC = 17.58% "XYZ = 12.62% Next 790F Clear Q Search LOCBA O 9:42 PM 1 6/9/2023Content X Airbnb Question X Bb Signature Inval X Bb Signature Inval X Airbnb in 2020 X Chapter 5 Quiz X C The following t X + V X -> C A mylab.pearson.com/Student/PlayerTest.aspx?testld=252322592 J Paused . . . hapter 5 Quiz Question 4 of 6 This quiz: 6 point(s) possible This question: 1 point(s) possible Submit qu list K The following table, , contains annual returns for the stocks of ABC Corp. (ABC) and XYZ Corp. (XYZ). The returns are calculated using end-of-year prices (adjusted for dividends and stock splits). Use the information for ABC Corp. (ABC) and XYZ Corp. (XYZ) to create an Excel spreadsheet that calculates the average returns over the 10-year period for portfolios comprised of ABC and XYZ using the following, respective, weightings: (1.0, 0.0), (0.9, 0.1), (0.8, 0.2), (0.7, 0.3), (0.6, 0.4), (0.5, 0.5), (0.4, 0.6), (0.3, 0.7), (0.2, 0.8), (0.1, 0.9), and (0.0, 1.0). The average annual returns over the 10-year period for ABC and XYZ are 17.58% and 12.62% respectively. Also, calculate the portfolio standard deviation over the 10-year period associated with each portfolio composition. The standard deviation over the 10-year period for ABC Corp. and XYZ Corp. and their correlation coefficient are 24.32%, 20.26%, and 0.82851 respectively. (Hint: Review Table 5.2.) Enter the average return and standard deviation for a portfolio with 80% ABC Corp. and 20% XYZ Corp. in the table below. (Round to two decimal places.) Portfolio Weights Portfolio Average Return Portfolio Standard Deviation WABC WXYZ ABC = 17.58% XYZ = 12.62% 0.8 0.2 % % Enter the average return and standard deviation for a portfolio with 70% ABC Corp. and 30% XYZ Corp. in the table below. (Round to two decimal places.) Portfolio Weights Portfolio Average Return Portfolio Standard Deviation WABC WXYZ ABC = 17.58% "XYZ = 12.62% Next 790F Clear Q Search O 9:43 PM 1 6/9/2023Content X Airbnb Question X Bb Signature Inval X Bb Signature Inval X Airbnb in 2020 X Chapter 5 Quiz X C The following t X + V X -> C A mylab.pearson.com/Student/PlayerTest.aspx?testld=252322592 J Paused . . . hapter 5 Quiz Question 4 of 6 This quiz: 6 point(s) possible This question: 1 point(s) possible Submit qu list K The following table, , contains annual returns for the stocks of ABC Corp. (ABC) and XYZ Corp. (XYZ). The returns are calculated using end-of-year prices (adjusted for dividends and stock splits). Use the information for ABC Corp. (ABC) and XYZ Corp. (XYZ) to create an Excel spreadsheet that calculates the average returns over the 10-year period for portfolios comprised of ABC and XYZ using the following, respective, weightings: (1.0, 0.0), (0.9, 0.1), (0.8, 0.2), (0.7, 0.3), (0.6, 0.4), (0.5, 0.5), (0.4, 0.6), (0.3, 0.7), (0.2, 0.8), (0.1, 0.9), and (0.0, 1.0). The average annual returns over the 10-year period for ABC and XYZ are 17.58% and 12.62% respectively. Also, calculate the portfolio standard deviation over the 10-year period associated with each portfolio composition. The standard deviation over the 10-year period for ABC Corp. and XYZ Corp. and their correlation coefficient are 24.32%, 20.26%, and 0.82851 respectively. (Hint: Review Table 5.2.) Portfolio Weights Portfolio Average Return Portfolio Standard Deviation WABC WXYZ ABC = 17.58% "XYZ = 12.62% 0.6 0.4 % % Enter the average return and standard deviation for a portfolio with 50% ABC Corp. and 50% XYZ Corp. in the table below. (Round to two decimal places.) Portfolio Weights Portfolio Average Return Portfolio Standard Deviation WABC WXYZ ABC = 17.58% XYZ = 12.62% 0.5 0.5 % 7% Next 790F 9:43 PM Clear Q Search O 1 6/9/2023Content X Airbnb Question X Bb Signature Inval X Bb Signature Inval X Airbnb in 2020 X Chapter 5 Quiz X C The following t X + V X -> C A mylab.pearson.com/Student/PlayerTest.aspx?testld=252322592 J Paused . . . hapter 5 Quiz Question 4 of 6 This quiz: 6 point(s) possible This question: 1 point(s) possible Submit qu list K The following table, , contains annual returns for the stocks of ABC Corp. (ABC) and XYZ Corp. (XYZ). The returns are calculated using end-of-year prices (adjusted for dividends and stock splits). Use the information for ABC Corp. (ABC) and XYZ Corp. (XYZ) to create an Excel spreadsheet that calculates the average returns over the 10-year period for portfolios comprised of ABC and XYZ using the following, respective, weightings: (1.0, 0.0), (0.9, 0.1), (0.8, 0.2), (0.7, 0.3), (0.6, 0.4), (0.5, 0.5), (0.4, 0.6), (0.3, 0.7), (0.2, 0.8), (0.1, 0.9), and (0.0, 1.0). The average annual returns over the 10-year period for ABC and XYZ are 17.58% and 12.62% respectively. Also, calculate the portfolio standard deviation over the 10-year period associated with each portfolio composition. The standard deviation over the 10-year period for ABC Corp. and XYZ Corp. and their correlation coefficient are 24.32%, 20.26%, and 0.82851 respectively. (Hint: Review Table 5.2.) Enter the average return and standard deviation for a portfolio with 40% ABC Corp. and 60% XYZ Corp. in the table below. (Round to two decimal places.) Portfolio Weights Portfolio Average Return Portfolio Standard Deviation WABC WXYZ ABC = 17.58% XYZ = 12.62% 0.4 0.6 % % Enter the average return and standard deviation for a portfolio with 30% ABC Corp. and 70% XYZ Corp. in the table below. (Round to two decimal places.) Portfolio Weights Portfolio Average Return Portfolio Standard Deviation WABC WXYZ ABC = 17.58% XYZ = 12.62% Next 790F 9:43 PM Clear Q Search O 1 6/9/2023Content X Airbnb Question X Bb Signature Inval X Bb Signature Inval X Airbnb in 2020 X Chapter 5 Quiz X C The following t X + V X -> C A mylab.pearson.com/Student/PlayerTest.aspx?testld=252322592 J Paused . . . hapter 5 Quiz Question 4 of 6 This quiz: 6 point(s) possible This question: 1 point(s) possible Submit qu list K The following table, , contains annual returns for the stocks of ABC Corp. (ABC) and XYZ Corp. (XYZ). The returns are calculated using end-of-year prices (adjusted for dividends and stock splits). Use the information for ABC Corp. (ABC) and XYZ Corp. (XYZ) to create an Excel spreadsheet that calculates the average returns over the 10-year period for portfolios comprised of ABC and XYZ using the following, respective, weightings: (1.0, 0.0), (0.9, 0.1), (0.8, 0.2), (0.7, 0.3), (0.6, 0.4), (0.5, 0.5), (0.4, 0.6), (0.3, 0.7), (0.2, 0.8), (0.1, 0.9), and (0.0, 1.0). The average annual returns over the 10-year period for ABC and XYZ are 17.58% and 12.62% respectively. Also, calculate the portfolio standard deviation over the 10-year period associated with each portfolio composition. The standard deviation over the 10-year period for ABC Corp. and XYZ Corp. and their correlation coefficient are 24.32%, 20.26%, and 0.82851 respectively. (Hint: Review Table 5.2.) Enter the average return and standard deviation for a portfolio with 20% ABC Corp. and 80% XYZ Corp. in the table below. (Round to two decimal places.) Portfolio Weights Portfolio Average Return Portfolio Standard Deviation WABC WXYZ ABC = 17.58% "XYZ = 12.62% 0.2 0.8 % Enter the average return and standard deviation for a portfolio with 10% ABC Corp. and 90% XYZ Corp. in the table below. (Round to two decimal places.) Portfolio Weights Portfolio Average Return Portfolio Standard Deviation WABC WXYZ ABC = 17.58% XYZ = 12.62% M.. M.. Next 790F 9:43 PM 1 Clear Q Search X 6/9/2023Content X Airbnb Question X Bb Signature Inval X Bb Signature Inval X Airbnb in 2020 X Chapter 5 Quiz X C The following t X + V X C A mylab.pearson.com/Student/PlayerTest.aspx?testld=252322592 Paused . . . hapter 5 Quiz Question 4 of 6 This quiz: 6 point(s) possible This question: 1 point(s) possible Submit qu list K The following table, contains annual returns for the stocks of ABC Corp. (ABC) and XYZ Corp. (XYZ). The returns are calculated using end-of-year prices (adjusted for dividends and stock splits). Use the information for ABC Corp. (ABC) and XYZ Corp. (XYZ) to create an Excel spreadsheet that calculates the average returns over the 10-year period for portfolios comprised of ABC and XYZ using the following, respective, weightings: (1.0, 0.0), (0.9, 0.1), (0.8, 0.2) (0.7, 0.3), (0.6, 0.4), (0.5, 0.5), (0.4, 0.6), (0.3, 0.7), (0.2, 0.8), (0.1, 0.9), and (0.0, 1.0). The average annual returns over the 10-year period for ABC and XYZ are 17.58% and 12.62% respectively. Also, calculate the portfolio standard deviation over the 10-year period associated with each portfolio composition. The standard deviation over the 10-year period for ABC Corp. and XYZ Corp. and their correlation coefficient are 24.32%, 20.26%, and 0.82851 respectively. (Hint: Review Table 5.2.) Portfolio Weights Portfolio Average Return Portfolio Standard Deviation WABC WXYZ ABC = 17.58% XYZ = 12.62% 0.1 0.9 1% % Enter the average return and standard deviation for a portfolio with 0% ABC Corp. and 100% XYZ Corp. in the table below. (Round to two decimal places.) Portfolio Weights Portfolio Average Return Portfolio Standard Deviation WABC WXYZ "ABC = 17.58% "XYZ = 12.62% 0.0 1.0 % Nex 790F 9:43 PM Clear Q Search X 6/9/2023Content X Airbnb Question X Bb Signature Inval X Bb Signature Inval X Airbnb in 2020 X Chapter 5 Quiz X C The following t X + V X C mylab.pearson.com/Student/PlayerTest.aspx?testld=252322592 Paused . . . hapter 5 Quiz pint(s) possible - X : 1 point(s) possible Data table Submit qu The foll list K returns are calculated using end-of-year prices ( Year ABC Returns XYZ Returns o create an Excel spreadsheet that calculates the average 2005 - 5.9% 15.2% weightings: (1.0, 0.0), (0.9, 0.1), (0.8, 0.2) (0.7, 0.3 2006 1.9% - 6.8% ns over the 10-year period for ABC and XYZ are 17.58% 2007 deviatio - 32.4% - 25.4% ted with each portfolio composition. The standard Table 5. 2008 - 11.2% - 4.4% 6%, and 0.82851 respectively. (Hint: Review 2009 29.6% 11.2% 2010 27.7% 10.1% 2011 22.6% 4.3% Enter the 2012 51.2% 41.6% able below. (Round to two decimal places.) 2013 37.9% 42.2% 2014 29.2% 38.6% 2015 28.8% 11.8% 2016 4.5% - 0.2% 2017 44.6% 25.8% Enter the able below. (Round to two decimal places.) Print Done 790F Clear Q Search X 9:43 PM 6/9/2023
Step by Step Solution
There are 3 Steps involved in it
1 Expert Approved Answer
Step: 1 Unlock
Question Has Been Solved by an Expert!
Get step-by-step solutions from verified subject matter experts
Step: 2 Unlock
Step: 3 Unlock
Students Have Also Explored These Related Finance Questions!