

Question: I am working on this assignment and got stacked. I am suppose to select the right data to produce a chart in excel. I will
I am working on this assignment and got stacked. I am suppose to select the right data to produce a chart in excel. I will attach a screenshot of the data and how the chart should look like.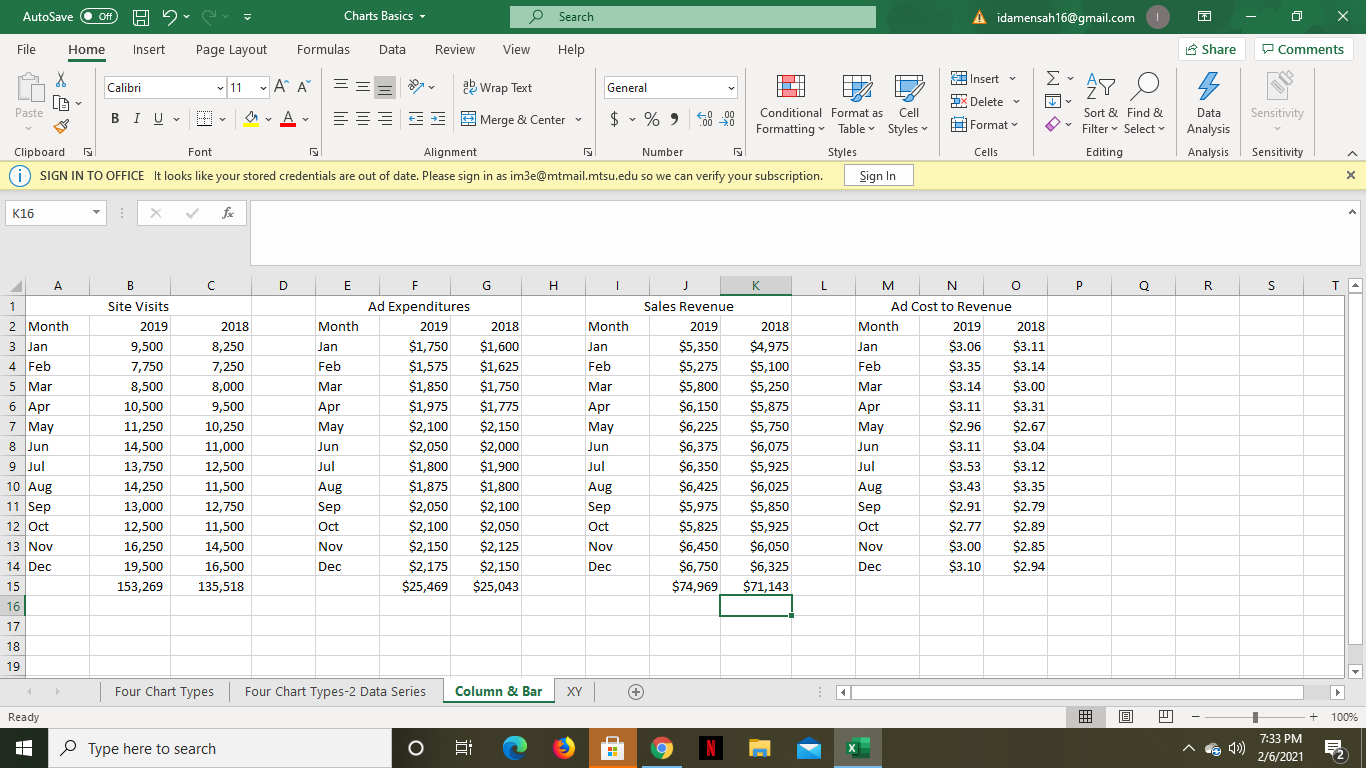
This is the data. Next is how the chart should look like. Please show which data you selected to create the charts to help me understand.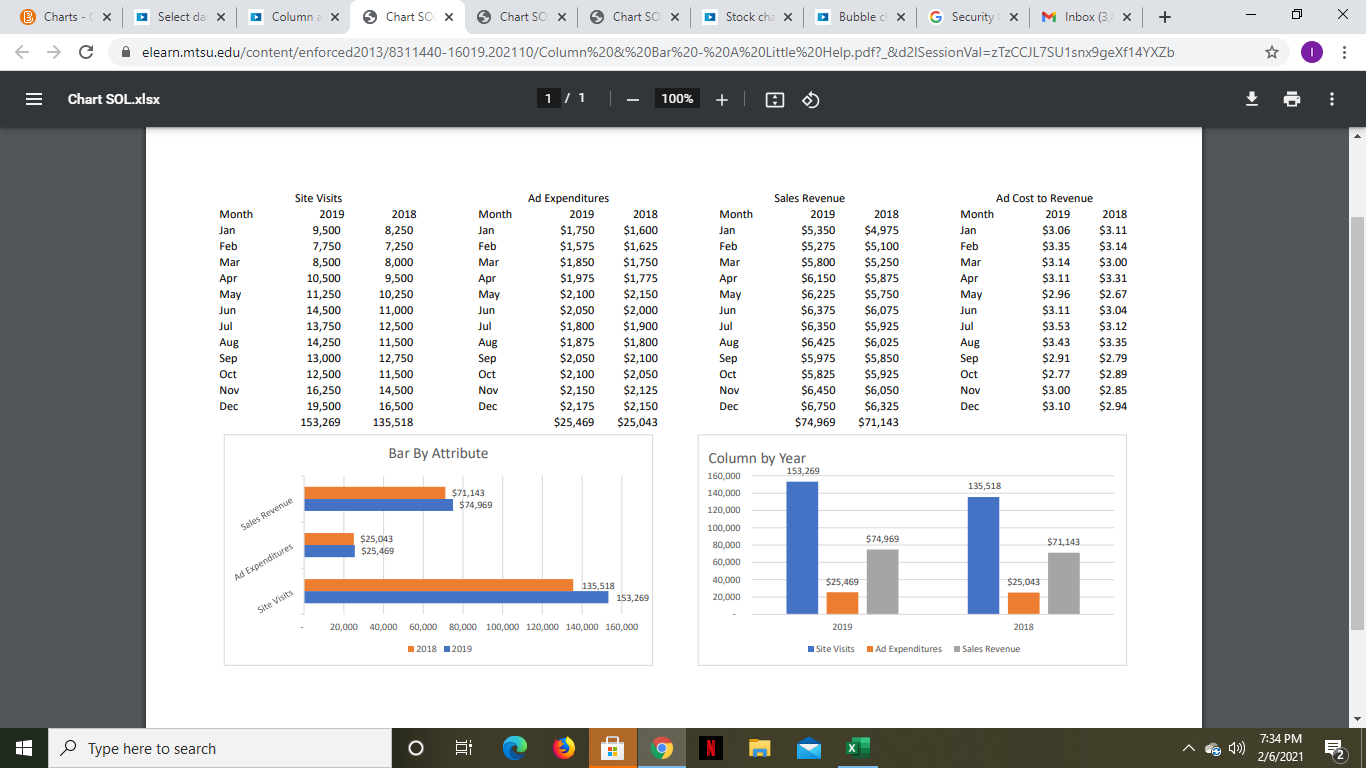
AutoSave Off H2 Charts Basics Search Aidamensah16@gmail.com 1 X File Home Insert Page Layout Formulas Data Review View Help Share Comments Insert AY O 5 2X Delete LIV 60 00 0 X Calibri 11AA = a Wrap Text General Paste BIU EE E Merge & Center $ %, Cell Conditional Format as Formatting Table Styles Clipboard Alignment Number Styles SIGN IN TO OFFICE It looks like your stored credentials are out of date. Please sign in as im3e@mtmail.mtsu.edu so we can verify your subscription. Sign In Sensitivity Format Sort & Find & Filter Select Editing Data Analysis Font Cells Analysis Sensitivity X K16 x fox A C D E I K L P Q R S T Month Jan Feb 1 2 Month 3 Jan 4 Feb 5 Mar 6 Apr 7 May 8 Jun 9 Jul B Site Visits 2019 9,500 7,750 8,500 10,500 11,250 14,500 13,750 14,250 13,000 12,500 16,250 19,500 153,269 2018 8,250 7,250 8,000 9,500 10,250 11,000 12,500 11,500 12,750 11,500 14,500 16,500 135,518 Month Jan Feb Mar Apr May Jun Jul Aug Sep Oct Nov G Ad Expenditures 2019 2018 $1,750 $1,600 $1,575 $1,625 $1,850 $1,750 $1,975 $1,775 $2,100 $2,150 $2,050 $2,000 $1,800 $1,900 $1,875 $1,800 $2,050 $2,100 $2,100 $2,050 $2,150 $2,125 $2,175 $2,150 $25,469 $25,043 Mar Apr May Jun Jul Aug Sep Oct Sales Revenue 2019 $5,350 $5,275 $5,800 $6,150 $6,225 $6,375 $6,350 $6,425 $5,975 $5,825 $6,450 $6,750 $74,969 2018 $4,975 $5,100 $5,250 $5,875 $5,750 $6,075 $5,925 $6,025 $5,850 $5,925 $6,050 $6,325 $71,143 M N o Ad Cost to Revenue Month 2019 2018 Jan $3.06 $3.11 Feb $3.35 $3.14 Mar $3.14 $3.00 Apr $3.11 $3.31 May $2.96 $2.67 Jun $3.11 $3.04 Jul $3.53 $3.12 Aug $3.43 $3.35 Sep $2.91 $2.79 Oct $2.77 $2.89 Nov $3.00 $2.85 Dec $3.10 $2.94 10 Aug 11 Sep 12 Oct Nov 13 Nov 14 Dec Dec Dec 15 16 17 18 19 Four Chart Types Four Chart Types-2 Data Series Column & Bar XY Ready 3 + 100% Type here to search o X 7:33 PM 2/6/2021 B Charts - x Select da X Column x Chart SOX S Chart SOX x Chart SOX Stock cha X x Bubble cx G Security x M Inbox (3.x | + elearn.mtsu.edu/content/enforced2013/8311440-16019.202110/Column%20&%20Bar%20-%20A%20Little%20Help.pdf?_8d21SessionVal=zTzCcJL7SU1snx9geXf14YXZb Chart SOL.xlsx 111 L 100% + Month Jan Feb Mar Apr May Jun Site Visits 2019 9,500 7,750 8,500 10,500 11,250 14,500 13,750 14,250 13,000 12,500 16,250 19,500 153,269 2018 8,250 7,250 8,000 9,500 10,250 11,000 12,500 11,500 12,750 11,500 14,500 16,500 135,518 Month Jan Feb Mar Apr May Jun Jul Aug Sep Oct Nov Dec Ad Expenditures 2019 2018 $1,750 $1,600 $1,575 $1,625 $1,850 $1,750 $1,975 $1,775 $2,100 $2,150 $2,050 $2,000 $1,800 $1,900 $1,875 $1,800 $2,050 $2,100 $2,100 $2,050 $2,150 $2,125 $2,175 $2,150 $25,469 $25,043 Month Jan Feb Mar Apr May Jun Jul Aug Sep Oct Nov Dec Sales Revenue 2019 $5,350 $5,275 $5,800 $6,150 $6,225 $6,375 $6,350 $6,425 $5,975 $5,825 $6,450 $6,750 $74,969 Jul 2018 $4,975 $5,100 $5,250 $5,875 $5,750 $6,075 $5,925 $6,025 $5,850 $5,925 $6,050 $6,325 $71,143 Ad Cost to Revenue Month 2019 2018 Jan $3.06 $3.11 Feb $3.35 $3.14 Mar . $3.14 $3.00 Apr $3.11 $3.31 May $2.96 $2.67 Jun $3.11 $3.04 Jul $3.53 $3.12 Aug $3.43 $3.35 Sep $2.91 $2.79 Oct $2.77 $2.89 Nov $3.00 $2.85 $3.10 $2.94 Aug Sep Oct Nov Dec Dec Bar By Attribute Column by Year 153,269 160,000 140,000 135,518 $71,143 $74,969 Sales Revenue $74,969 $25,043 $25,469 $71,143 120,000 100,000 80,000 60,000 40,000 20,000 Ad Expenditures $25,469 $25,043 135,518 153,269 Site Visits 20,000 40,000 60,000 80,000 100,000 120,000 140,000 160,000 2019 2018 2018 2019 Site Visits Ad Expenditures Sales Revenue 1 Type here to search N 7:34 PM 2/6/2021 AutoSave Off H2 Charts Basics Search Aidamensah16@gmail.com 1 X File Home Insert Page Layout Formulas Data Review View Help Share Comments Insert AY O 5 2X Delete LIV 60 00 0 X Calibri 11AA = a Wrap Text General Paste BIU EE E Merge & Center $ %, Cell Conditional Format as Formatting Table Styles Clipboard Alignment Number Styles SIGN IN TO OFFICE It looks like your stored credentials are out of date. Please sign in as im3e@mtmail.mtsu.edu so we can verify your subscription. Sign In Sensitivity Format Sort & Find & Filter Select Editing Data Analysis Font Cells Analysis Sensitivity X K16 x fox A C D E I K L P Q R S T Month Jan Feb 1 2 Month 3 Jan 4 Feb 5 Mar 6 Apr 7 May 8 Jun 9 Jul B Site Visits 2019 9,500 7,750 8,500 10,500 11,250 14,500 13,750 14,250 13,000 12,500 16,250 19,500 153,269 2018 8,250 7,250 8,000 9,500 10,250 11,000 12,500 11,500 12,750 11,500 14,500 16,500 135,518 Month Jan Feb Mar Apr May Jun Jul Aug Sep Oct Nov G Ad Expenditures 2019 2018 $1,750 $1,600 $1,575 $1,625 $1,850 $1,750 $1,975 $1,775 $2,100 $2,150 $2,050 $2,000 $1,800 $1,900 $1,875 $1,800 $2,050 $2,100 $2,100 $2,050 $2,150 $2,125 $2,175 $2,150 $25,469 $25,043 Mar Apr May Jun Jul Aug Sep Oct Sales Revenue 2019 $5,350 $5,275 $5,800 $6,150 $6,225 $6,375 $6,350 $6,425 $5,975 $5,825 $6,450 $6,750 $74,969 2018 $4,975 $5,100 $5,250 $5,875 $5,750 $6,075 $5,925 $6,025 $5,850 $5,925 $6,050 $6,325 $71,143 M N o Ad Cost to Revenue Month 2019 2018 Jan $3.06 $3.11 Feb $3.35 $3.14 Mar $3.14 $3.00 Apr $3.11 $3.31 May $2.96 $2.67 Jun $3.11 $3.04 Jul $3.53 $3.12 Aug $3.43 $3.35 Sep $2.91 $2.79 Oct $2.77 $2.89 Nov $3.00 $2.85 Dec $3.10 $2.94 10 Aug 11 Sep 12 Oct Nov 13 Nov 14 Dec Dec Dec 15 16 17 18 19 Four Chart Types Four Chart Types-2 Data Series Column & Bar XY Ready 3 + 100% Type here to search o X 7:33 PM 2/6/2021 B Charts - x Select da X Column x Chart SOX S Chart SOX x Chart SOX Stock cha X x Bubble cx G Security x M Inbox (3.x | + elearn.mtsu.edu/content/enforced2013/8311440-16019.202110/Column%20&%20Bar%20-%20A%20Little%20Help.pdf?_8d21SessionVal=zTzCcJL7SU1snx9geXf14YXZb Chart SOL.xlsx 111 L 100% + Month Jan Feb Mar Apr May Jun Site Visits 2019 9,500 7,750 8,500 10,500 11,250 14,500 13,750 14,250 13,000 12,500 16,250 19,500 153,269 2018 8,250 7,250 8,000 9,500 10,250 11,000 12,500 11,500 12,750 11,500 14,500 16,500 135,518 Month Jan Feb Mar Apr May Jun Jul Aug Sep Oct Nov Dec Ad Expenditures 2019 2018 $1,750 $1,600 $1,575 $1,625 $1,850 $1,750 $1,975 $1,775 $2,100 $2,150 $2,050 $2,000 $1,800 $1,900 $1,875 $1,800 $2,050 $2,100 $2,100 $2,050 $2,150 $2,125 $2,175 $2,150 $25,469 $25,043 Month Jan Feb Mar Apr May Jun Jul Aug Sep Oct Nov Dec Sales Revenue 2019 $5,350 $5,275 $5,800 $6,150 $6,225 $6,375 $6,350 $6,425 $5,975 $5,825 $6,450 $6,750 $74,969 Jul 2018 $4,975 $5,100 $5,250 $5,875 $5,750 $6,075 $5,925 $6,025 $5,850 $5,925 $6,050 $6,325 $71,143 Ad Cost to Revenue Month 2019 2018 Jan $3.06 $3.11 Feb $3.35 $3.14 Mar . $3.14 $3.00 Apr $3.11 $3.31 May $2.96 $2.67 Jun $3.11 $3.04 Jul $3.53 $3.12 Aug $3.43 $3.35 Sep $2.91 $2.79 Oct $2.77 $2.89 Nov $3.00 $2.85 $3.10 $2.94 Aug Sep Oct Nov Dec Dec Bar By Attribute Column by Year 153,269 160,000 140,000 135,518 $71,143 $74,969 Sales Revenue $74,969 $25,043 $25,469 $71,143 120,000 100,000 80,000 60,000 40,000 20,000 Ad Expenditures $25,469 $25,043 135,518 153,269 Site Visits 20,000 40,000 60,000 80,000 100,000 120,000 140,000 160,000 2019 2018 2018 2019 Site Visits Ad Expenditures Sales Revenue 1 Type here to search N 7:34 PM 2/6/2021
Step by Step Solution
There are 3 Steps involved in it

Get step-by-step solutions from verified subject matter experts