

Question: I do not understand how to perform these. Please explain 1. Two P Charts [A and B) have the same center line. The sample size
I do not understand how to perform these. Please explain
1.
![size for each point plotted on A is 10'] and the sample](https://s3.amazonaws.com/si.experts.images/answers/2024/07/668bfbaa38abd_962668bfbaa139a0.jpg)

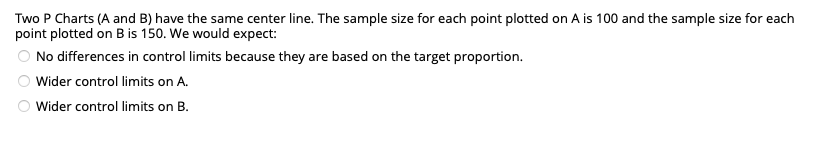
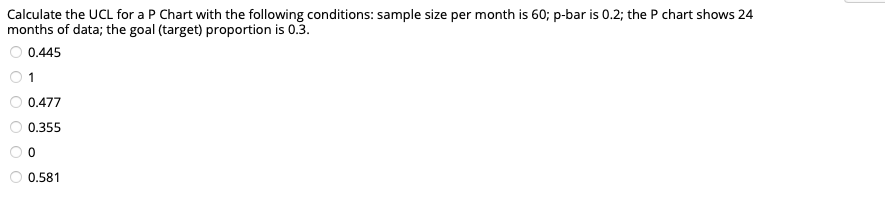
Two P Charts [A and B) have the same center line. The sample size for each point plotted on A is 10'] and the sample size for each point plotted on B is 150. We would expect: ' No differences in control limits because they are based on the target prepnrlinn. ' Wider control limits on A. ' Wider control limits on B. Calculate the UCL for a P Chart with the following conditions: sample size per month is 50; p-har is 0.2; the P chart shows 24 months of data: the goal [target] proporlion is 0.3. ' 0.445 ' 1 ' 0.477 ' 0.355 ' 0.531 A company produces 4 million computer keyboards each month and each keyboard includes 136 keys each. The defect rate is 14.8 defects per million keys. If a key is defective the cost to the company is $4.12 [to replace the key). A lean six sigma project is proposed that will reduce ihe defect rate to 612 defects per million keys. How much can a company save per year if a process improvement project is clone? less man $50000 ' between $50000 and 3100000 ' between $100000 and $150000 ' between $150000 and $200000 ' between $200000 and $250000 ' more than $250000 If the 95% confidence interval for the likelihood of a satisfied customer is 0.687 to 0.793: O If we remain stable the next satisfaction survey will show a satisfaction rate between 0.687 and 0.793 O We are 100% sure that the true likelihood of a satisfied customer is between 0.687 to 0.793 O There is a 5% chance that the true likelihood of a satisfied customer is less than 0.687 or greater than 0.793
Step by Step Solution
There are 3 Steps involved in it

Get step-by-step solutions from verified subject matter experts