

Question: I have about 70 more data sets but im just looking for some insight as to how i work this out and how i get
I have about 70 more data sets but im just looking for some insight as to how i work this out and how i get my forecast as well as my forecast error. Thank you in advance.
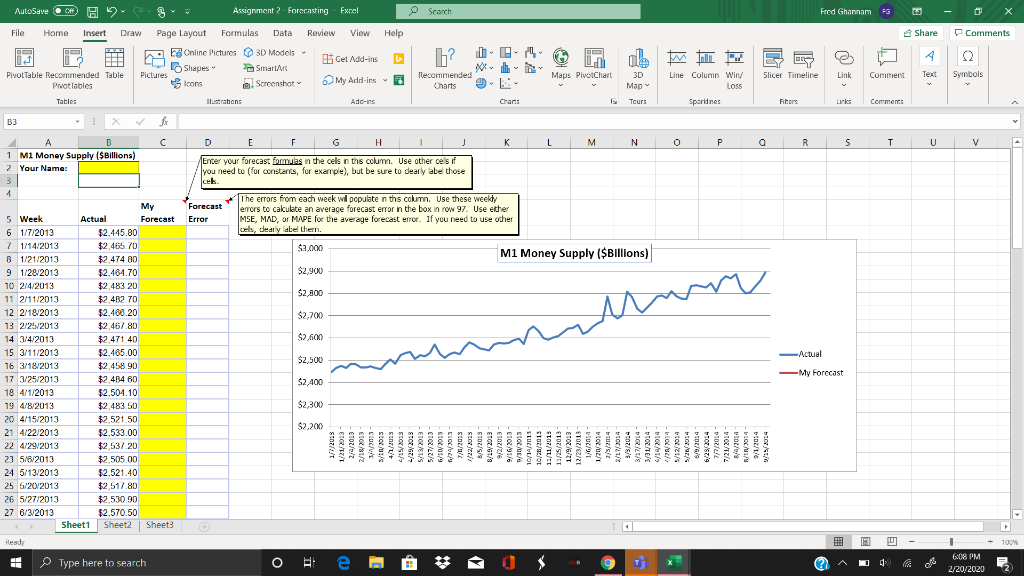
Use Excel formulas to create whichever one time-series forecasting model you would like. Also create using Excel any one of the following error statistics - MSE, MAD, or MAPE - to show the average forecasting error of your model. To receive credit, you must build formulas within Excel, and not just show raw numbers or text-like typed-out formulas in cells
Fred Ghannam 3 - 0 x Comments Share 3D Line Column Win/ Maps PivolChart Slicer Timeline Link Comment Text Symbols Charts Loss AutoSave C H2 File Home Insert Draw Page Layout Formulas Data Review View Help 13 1 7 - 8 Online Pictures 3D Models - Get Add-ins h? - Shapes SmartArt PivotTable Recommended Table Pictures Recommended Pivotlables loons My Add-ins Screenshot Tables llustrations Ado-ins B3 2 A B C D E F G H I J 1 Mi Money Supply ($Billions) Enter your forecast formulas in the cels in this column. Use other cels if 2 Your Name: you need to for constants, for example), but be sure to dearly label those Map Tours Charts Sparidnes Fit Comments K L M N O P R S T U V ket Forecast Error I he errors from each week w populten this column. Use these weekly errors to calculate an average forecast error in the box in ron 97. Use either MSE, MAD, or MAPE for the average forecast error. If you need to use other cells, deaty dle then. $2,000 $2,900 M1 Money Supply ($Bilions) 52800 Actual My 5 Week Actual Forecast 6 1/7/2013 $2,445.80 71/14/2013 $2.465.70 6 1/21/2013 $2,474.80 9 1/28/2013 $2,464.70 10 2/4/2013 $2.483.20 11 2/11/2013 $2.462.70 12 2/18/2013 $2,468.20 13 2/25/2013 $2,467.80 14 3/4/2013 $2,471 40 15 3/11/2013 $2,465.00 16 3/18/2013 $2,458.90 17 3/25/2013 $2,484 60 18 4/1/2013 $2,504.10 19 4/8/2013 2.483.50 20 4/15/2013 $2,521 50 21 422/2013 $2,533.00 22 4/29/2013 $2,537 20 23 516/2013 $2,505.00 24 5/13/2013 $2.521.40 25 5/20/2013 $2,517.80 26 5/27/2013 $2,530.90 27 6/3/2013 $2,570.50 Sheet1 Sheet2 Sheet3 My Forecast - ETOT/ 2014 1/2/2013 2/18/2013 - - CUL/ Stoc/I/S - Stoc/91/ 2014 2/29/2013 5/13/2013 - 5/27/2013 - 6/10/2013 CLOXA-2/9 8/19/2013 - ETOT/7/6 9/16/2013 - Stoc/0/6 10/14/2015 10/11/2013 12/11/2013 11/25/2013 - ETOP/G/ZT - ETOZ/E2/2T - DIOC/9/1 tout 2/17/2014 3/8/2014 3/17/2014 - 3/31/2014 - 4/14/2014 - DOCS/ bloc/21/S 5/25/2014 6/29/2014 7/7/2014 7/21/2014 - R/ 9/ 1 - 1 608 PM + 100% Type here to search o e 500 2/20/20202Step by Step Solution
There are 3 Steps involved in it
1 Expert Approved Answer
Step: 1 Unlock

Question Has Been Solved by an Expert!
Get step-by-step solutions from verified subject matter experts
Step: 2 Unlock
Step: 3 Unlock