

Question: I have been taking the class online and the practice problems I have been working on do not include all relevant steps necessary to solving.
I have been taking the class online and the practice problems I have been working on do not include all relevant steps necessary to solving. So if you could please help provide the steps or methods that would be appreciated. The example in the homework does not show how they found the example for the Stewart factor for the chart.
1.) The Shewhart factor for the x?-chart is A2 are
2.)The Shewhart factors for the?R-chart are
D3 =___ D4 =___
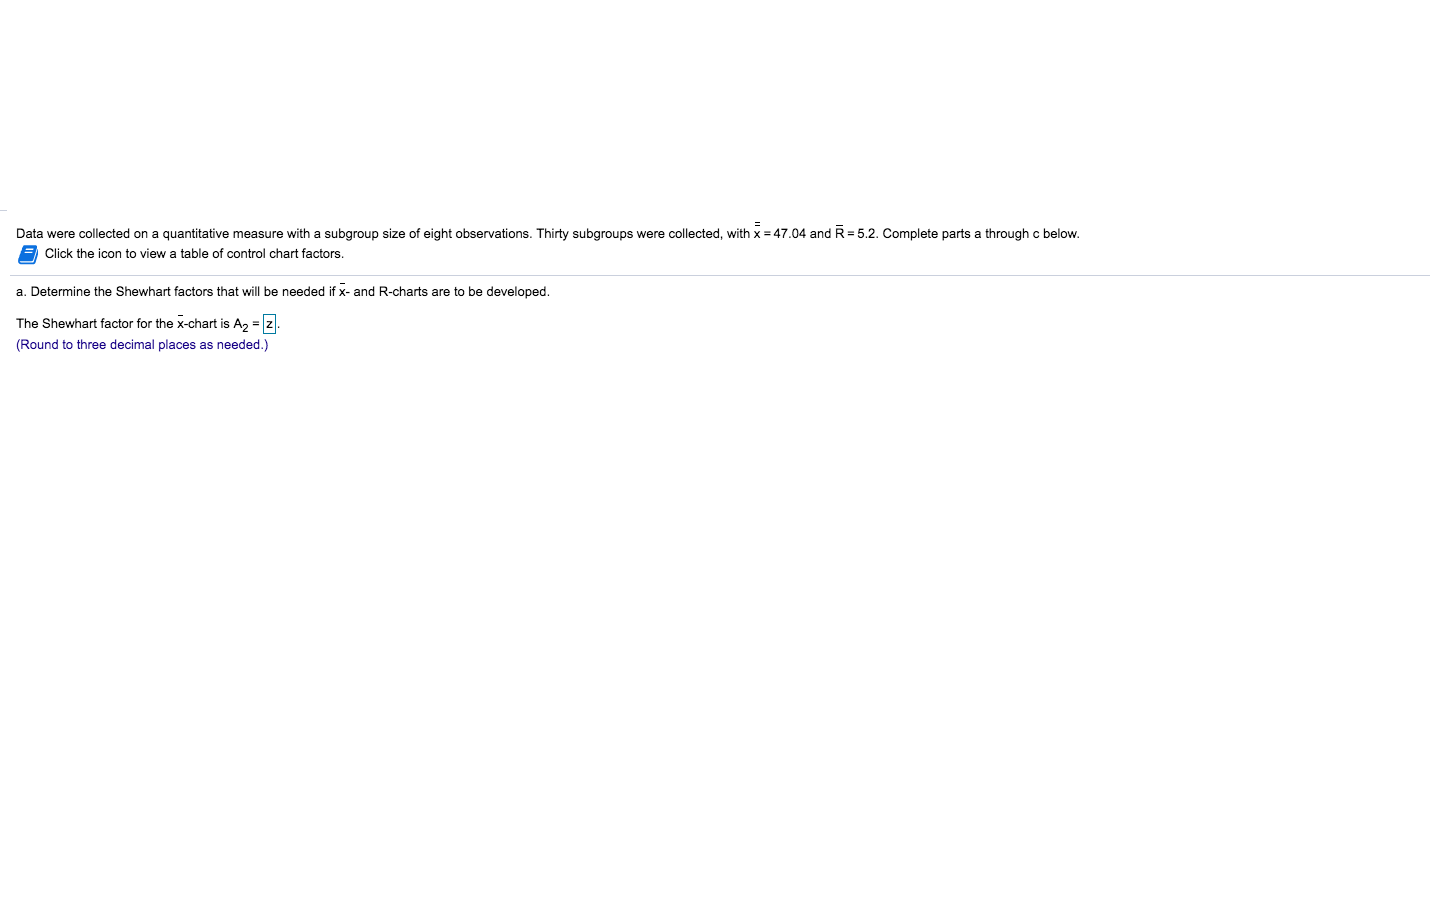
5.2 Complete Data were collected on a quantitative measure with a subgroup size of eight observations . Thirty subgroups were collected , with * = 47 04 and R = 5.2 . Complete parts a through c below 2 Click the icon to view a table of control chart factors a Determine the Shewhart factors that will be needed if X - and R - charts are to be developed The Shewhart factor for the x -chart is A 2 ( Round to three decimal places as needed )
Step by Step Solution
There are 3 Steps involved in it

Get step-by-step solutions from verified subject matter experts