

Question: I have been trying get some help with this question 6. But everyone is saying that the question is incomplete. I get from the book
I have been trying get some help with this question 6. But everyone is saying that the question is incomplete.
I get from the book and nobody is able to help me.
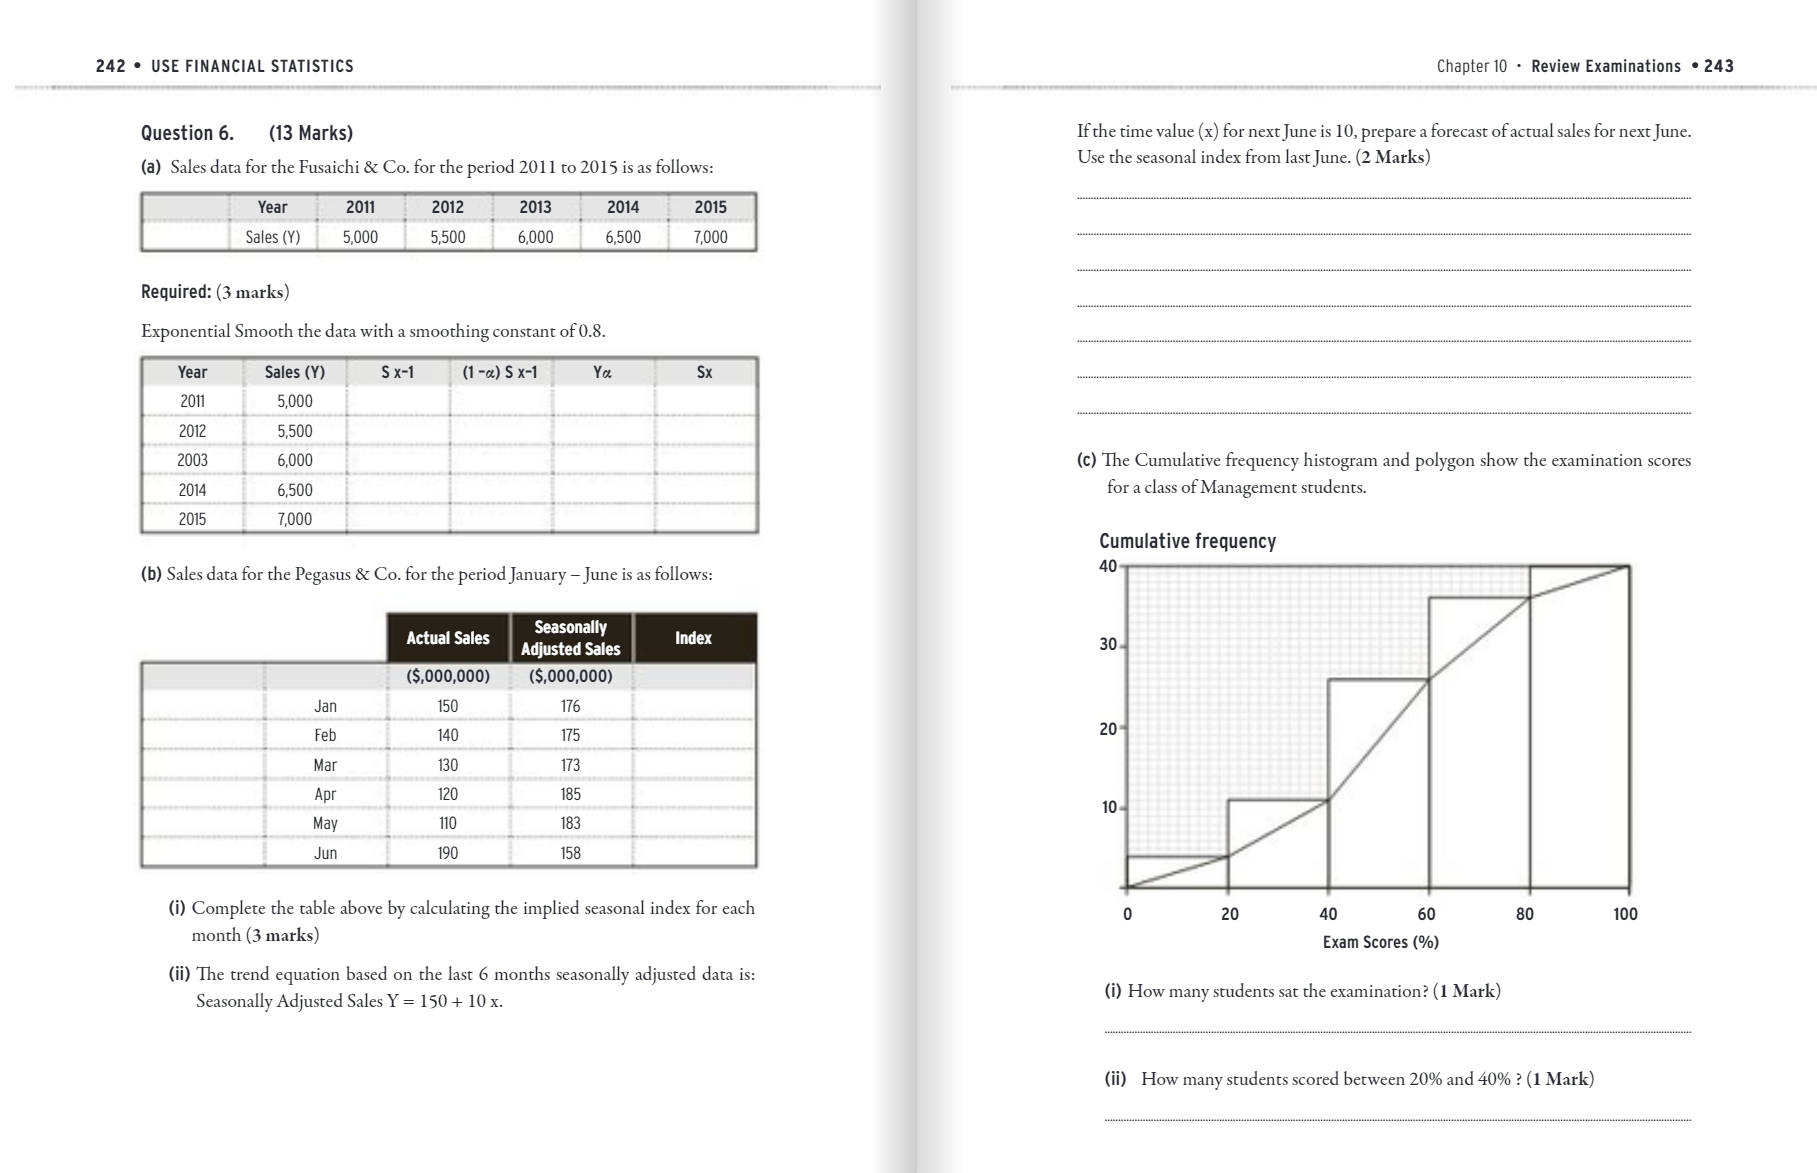
242 . USE FINANCIAL STATISTICS Chapter 10 . Review Examinations . 243 Question 6. (13 Marks) If the time value (x) for next June is 10, prepare a forecast of actual sales for next June. (a) Sales data for the Fusaichi & Co. for the period 2011 to 2015 is as follows: Use the seasonal index from last June. (2 Marks) Year 2011 2012 2013 2014 2015 Sales (Y) 5,000 5,500 6,000 6.500 7,000 Required: (3 marks) Exponential Smooth the data with a smoothing constant of 0.8. Year Sales (Y) S X-1 (1 -a) S x-1 Ya SX 2011 5,000 2012 5,500 2003 6,000 (c) The Cumulative frequency histogram and polygon show the examination scores 2014 ,500 for a class of Management students. 2015 7.000 Cumulative frequency (b) Sales data for the Pegasus & Co. for the period January - June is as follows: 40 Actual Sales Seasonally Adjusted Sales Index 30 ($,000,000) ($,000,000) Jan 150 176 Feb 140 175 20 Mar 130 173 Apr 120 185 10 May 110 183 Jun 190 158 (i) Complete the table above by calculating the implied seasonal index for each 20 40 60 80 100 month (3 marks) Exam Scores (%) (ii) The trend equation based on the last 6 months seasonally adjusted data is: Seasonally Adjusted Sales Y = 150 + 10 x. (i) How many students sat the examination? (1 Mark) (ii) How many students scored between 20% and 40% ? (1 Mark)
Step by Step Solution
There are 3 Steps involved in it

Get step-by-step solutions from verified subject matter experts