

Question: I have plotted the Weibull plot for 95% Confidence Level using origin pro. The circles in red are percentiles. Could anyone explain in detail what
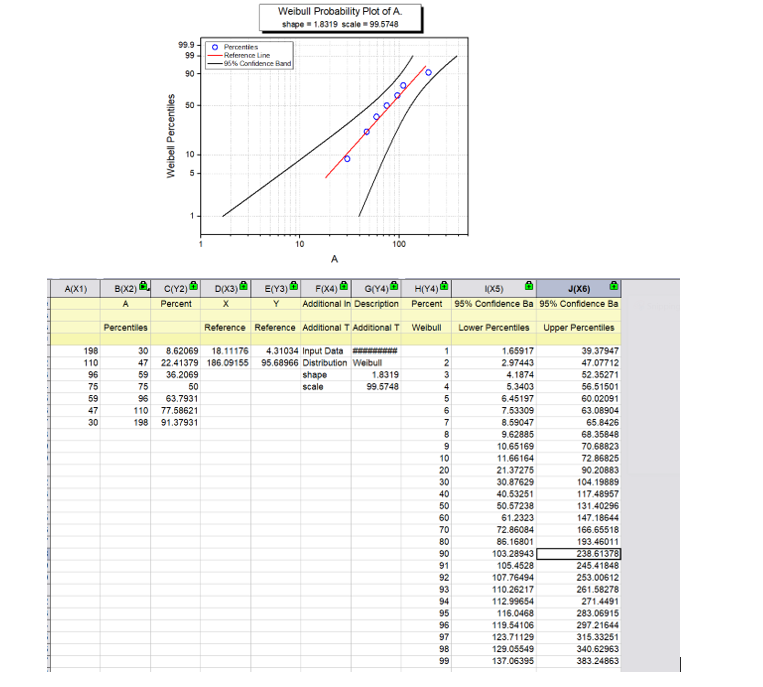
I have plotted the Weibull plot for 95% Confidence Level using origin pro. The circles in red are percentiles. Could anyone explain in detail what these percentiles are what the numbers in the long list mean?
Weibull Probability Plot of A. shape - 1,8319 scale = 99.5748 99.9 99 O Percenties Reference Line -95% Confidence Band 90- o 50 Weibell Percentiles 10 5 10 100 A(X1) B(x2) CY2) D(x3) E(Y3) F(x4) @ G[Y4* H(74) Additional In Description Percent 1X5) J(X6) 95% Confidence Ba 95% Confidence Ba Percent Y Percentiles Reference Reference Additional T Additional T Weibull Lower Percentiles Upper Percentiles 198 110 96 75 59 47 30 30 8.62069 18.11176 47 22.41379 186.09155 59 36.2069 75 50 96 63.7931 110 77.58621 198 91.37931 4.31034 Input Data 95.68966 Distribution Weibull shape 1.8319 scale 99.5748 1 1 2 3 4 5 6 7 8 9 10 20 30 40 50 60 70 80 90 91 92 93 94 95 96 97 98 99 1.65917 2.97443 4.1874 5.3403 6.45197 7.53309 8.59047 9.62885 10.65169 11.66164 21.37275 30.87629 40.53251 50.57238 61.2323 72.86084 86.16801 103.28943 105.4528 107.76494 110.26217 112.99654 116.0468 119.54106 123.71129 129.05549 137.06395 3937947 47.07712 52.35271 56.51501 60.02091 63,08904 65.8426 68.35848 70.68823 72. 86825 90 20883 104.19889 117.48957 131.40296 147.18644 166.65518 193.46011 238.61378 245.41848 253.00612 261.58278 271.4491 283.06915 297 21644 315.33251 340.62963 383.24863 ! Weibull Probability Plot of A. shape - 1,8319 scale = 99.5748 99.9 99 O Percenties Reference Line -95% Confidence Band 90- o 50 Weibell Percentiles 10 5 10 100 A(X1) B(x2) CY2) D(x3) E(Y3) F(x4) @ G[Y4* H(74) Additional In Description Percent 1X5) J(X6) 95% Confidence Ba 95% Confidence Ba Percent Y Percentiles Reference Reference Additional T Additional T Weibull Lower Percentiles Upper Percentiles 198 110 96 75 59 47 30 30 8.62069 18.11176 47 22.41379 186.09155 59 36.2069 75 50 96 63.7931 110 77.58621 198 91.37931 4.31034 Input Data 95.68966 Distribution Weibull shape 1.8319 scale 99.5748 1 1 2 3 4 5 6 7 8 9 10 20 30 40 50 60 70 80 90 91 92 93 94 95 96 97 98 99 1.65917 2.97443 4.1874 5.3403 6.45197 7.53309 8.59047 9.62885 10.65169 11.66164 21.37275 30.87629 40.53251 50.57238 61.2323 72.86084 86.16801 103.28943 105.4528 107.76494 110.26217 112.99654 116.0468 119.54106 123.71129 129.05549 137.06395 3937947 47.07712 52.35271 56.51501 60.02091 63,08904 65.8426 68.35848 70.68823 72. 86825 90 20883 104.19889 117.48957 131.40296 147.18644 166.65518 193.46011 238.61378 245.41848 253.00612 261.58278 271.4491 283.06915 297 21644 315.33251 340.62963 383.24863Step by Step Solution
There are 3 Steps involved in it
1 Expert Approved Answer
Step: 1 Unlock

Question Has Been Solved by an Expert!
Get step-by-step solutions from verified subject matter experts
Step: 2 Unlock
Step: 3 Unlock