

Question: I have provided the python code all I need is the plot graph with appropriate labels, a title and legend . I will rate.c )
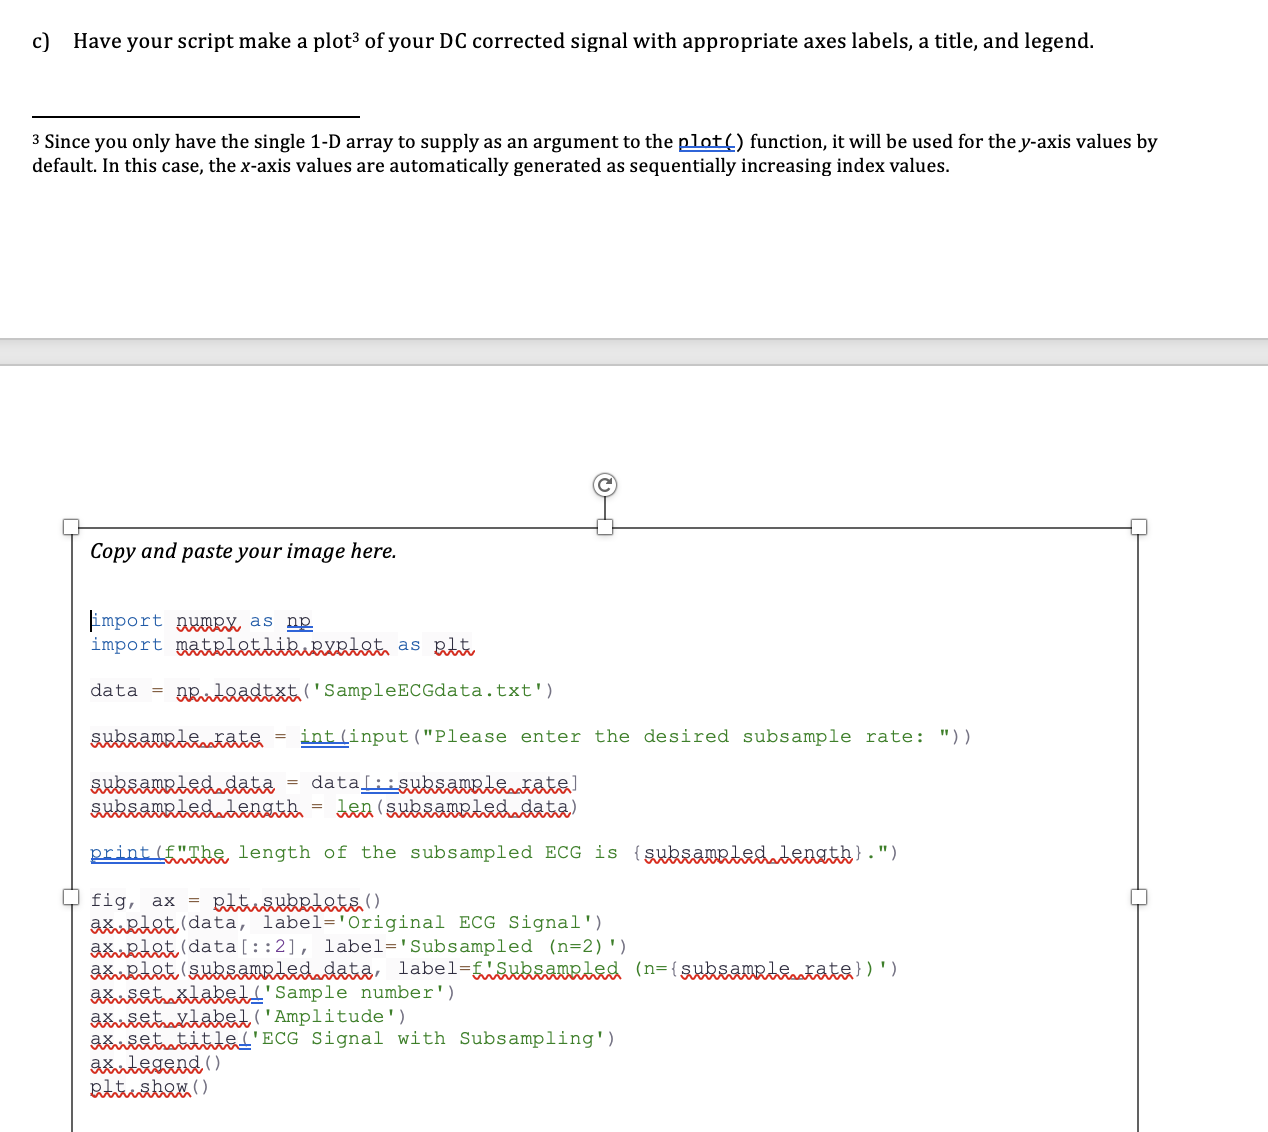
I have provided the python code all I need is the plot graph with appropriate labels, a title and legend I will rate.c Have your script make a plot of your DC corrected signal with appropriate axes labels, a title, and legend.
Since you only have the single D array to supply as an argument to the plot f function, it will be used for the axis values by
default. In this case, the axis values are automatically generated as sequentially increasing index values.
Copy and paste your image here.
jimport numpe as np
import matrietlibuxplot as plt
data nhiniadtxt SampleECGdatatxt
Subsamplenate int inputPlease enter the desired subsample rate:
Subsampled data data ::subsamplenate
subsamplednlength len subsampledadata
print fThe length of the subsampled ECG is subsampledalength
fig, pltisublots
axidit data label'Original ECG Signal'
axirlutdata :: label'Subsampled
axinlot subsampled data, labelf'SubsamRled subsamplenate I
Step by Step Solution
There are 3 Steps involved in it
1 Expert Approved Answer
Step: 1 Unlock

Question Has Been Solved by an Expert!
Get step-by-step solutions from verified subject matter experts
Step: 2 Unlock
Step: 3 Unlock