

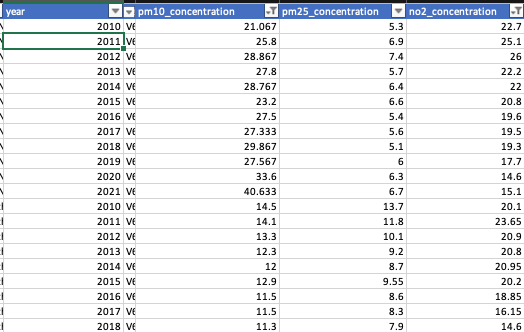
Question: I have some environmental data and I want to plot a chart of all 3 columns on one chart using line graphs. Each row has
I have some environmental data and I want to plot a chart of all columns on one chart using line graphs. Each row has a year. How can I average each environemntal item by year then plot them? Can someone help me plot this in R using ggplot? There are several hundred rows.
Step by Step Solution
There are 3 Steps involved in it
1 Expert Approved Answer
Step: 1 Unlock

Question Has Been Solved by an Expert!
Get step-by-step solutions from verified subject matter experts
Step: 2 Unlock
Step: 3 Unlock