

Question: I have the following python code making a bunch of subplots. I need to edit these graphs so that there is only labels on the
I have the following python code making a bunch of subplots.
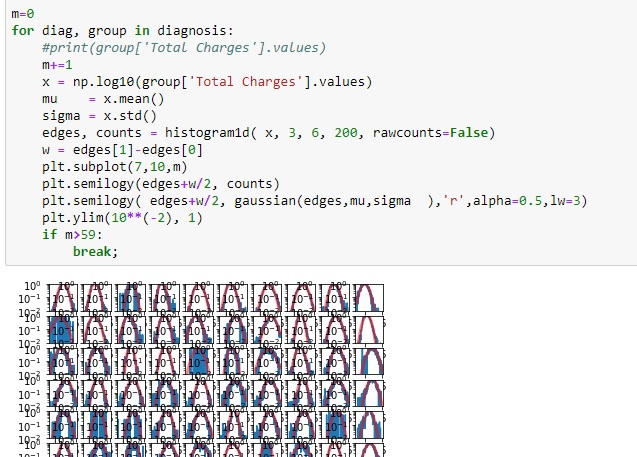
I need to edit these graphs so that there is only labels on the bottom left corner subplot, I need to resize them to make them bigger, and I also need to add titles. Diagnosis is a groupby object that has the diagnosis and then the data that corresponds to that diagnosis in a tuple. Each sublplot is the charges of each diagnosis. I need the titles to be the specific Diagnosis on each graph and for them to be seperated enough you can see and read the titles or in other words the first value in each tuple is the tiltles if that makes more sense.
Step by Step Solution
There are 3 Steps involved in it
1 Expert Approved Answer
Step: 1 Unlock

Question Has Been Solved by an Expert!
Get step-by-step solutions from verified subject matter experts
Step: 2 Unlock
Step: 3 Unlock