

Question: i keep getting these wrong need help Graphs Taxes Help Save & 10 20 30 50 0 70 30 30 Quantity thousands ) $50.00 4,000
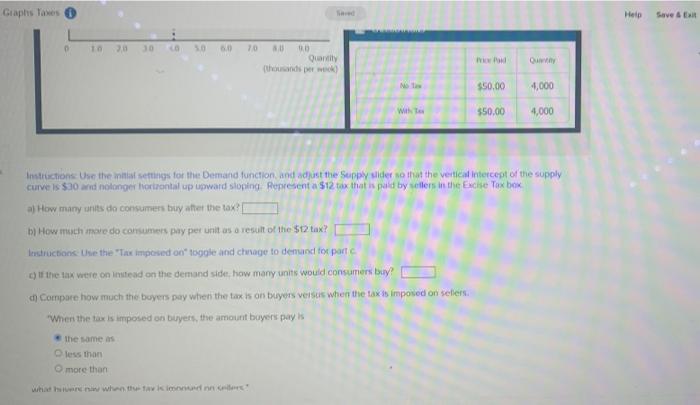
Graphs Taxes Help Save & 10 20 30 50 0 70 30 30 Quantity thousands ) $50.00 4,000 WIN $50,00 4,000 Instructions Use the settings for the Demand function and adjust the supply slider so that the vertical intercept of the supply curve is $30 and nolonger Horizontal up upward slopina Representa $12 tax that is paid by sellers in the Exche Tox box aj How many crits de consumers buy after the tax? b) How much more do consumers pay per unit as a result of the 512 tax? estructions. Use the "Tax imposed ontogole and change to demand for part c) of the tax were on instead on the demand side, how many units would consumers buy? ch Compare how much the buyers pay when the tax is on buyers versus when the tax is imposed on sellers When the tax is imposed on buyers, the amount buyers pays the same less than more than What what is
Step by Step Solution
There are 3 Steps involved in it

Get step-by-step solutions from verified subject matter experts