

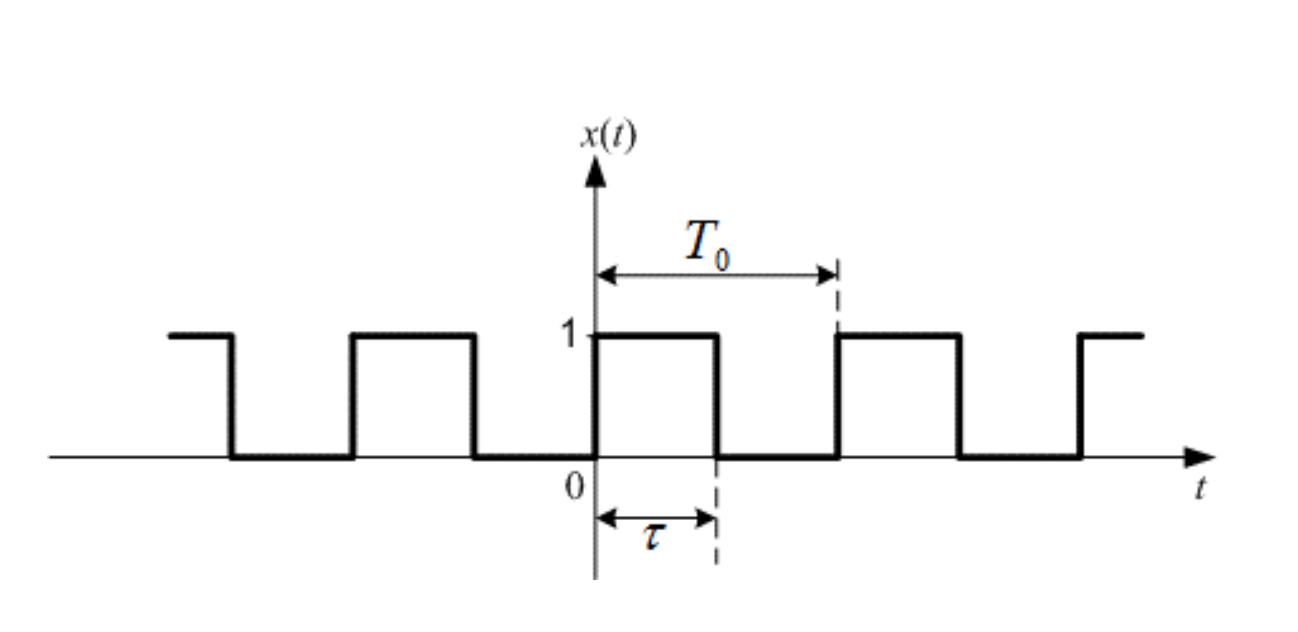
Question: I ' m to plot the following signal using matlab using Fourier Series. The frequency is 2 0 kHz . Below are the manual calculation
Im to plot the following signal using matlab using Fourier Series. The frequency is kHz Below are the manual calculation for the trigonometric Fourier series done by myself. Below are my Matlab codings. Is my manual calculation have mistakewrong Or my coding is wrong? Why the matlab gives a graph that is not same with the first picture? How can I get the frequency domain from my manual calculation of xt Thank you! I would upvote if you give good answer, and viceversa.
My Matlab Codings:
t ::;
figure;
Finalxt zerossizet;
for n :;
Individualtermofxt n pi sin n t pi ;
Finalxt Finalxt Individualtermofxt;
end end the for loop
FinalFinalxt Finalxt
subplot
plott realFinalFinalxt;
titlext for n to ;
xlabelTime s;
ylabelAmplitude;
grid on;
Step by Step Solution
There are 3 Steps involved in it
1 Expert Approved Answer
Step: 1 Unlock

Question Has Been Solved by an Expert!
Get step-by-step solutions from verified subject matter experts
Step: 2 Unlock
Step: 3 Unlock