

Question: I must be really overthinking this. Please help. 2. Scatter Plots using Matplotlib & Numpy (9 pts) Note: To create a Scatter Plot you must
I must be really overthinking this. Please help.
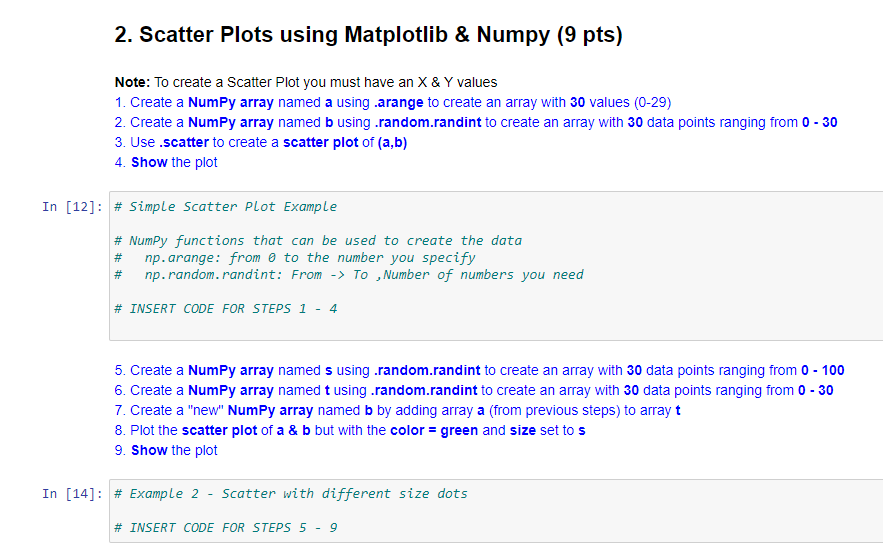
2. Scatter Plots using Matplotlib & Numpy (9 pts) Note: To create a Scatter Plot you must have an X & Y values 1. Create a Numpy array named a using .arange to create an array with 30 values (0-29) 2. Create a Numpy array named b using .random.randint to create an array with 30 data points ranging from 0 - 30 3. Use .scatter to create a scatter plot of (a,b) 4. Show the plot In [12]: # Simple Scatter Plot Example # Numpy functions that can be used to create the data # np.arange: from a to the number you specify # np.random.randint: From -> To Number of numbers you need # INSERT CODE FOR STEPS 1 - 4 5. Create a Numpy array named s using .random.randint to create an array with 30 data points ranging from 0 - 100 6. Create a Numpy array named t using .random.randint to create an array with 30 data points ranging from 0 - 30 7. Create a "new" NumPy array named b by adding array a (from previous steps) to array t 8. Plot the scatter plot of a & b but with the color=green and size set to s 9. Show the plot In [14]: # Example 2 - Scatter with different size dots # INSERT CODE FOR STEPS 5 - 9
Step by Step Solution
There are 3 Steps involved in it

Get step-by-step solutions from verified subject matter experts