

Question: I need a script to run this without using any built in functions of matlab, this is what I have so far, but it is
I need a script to run this without using any built in functions of matlab, this is what I have so far, but it is for a linear least square fitting, if possible how would I rewrite my code to make it work for a parabola.
function Isaline
%Loads data as "data2" load('Lab 8 data2.mat');
%Retrieves the size of the data [m,n] = size(data2);
%Form coefficient matrix A and right hand side b in Ax=b A = ones(m,2);
%First column of A is the coefficients of C which are t values A(:,1) = data2(:,1);
%b = y values b = data2(:,2);
%Finds the least square solution x From the projection of b onto the column %space of A x = (A'*A)\(A'*b); %Retrieve the parameters C and D C = x(0); D = x(1);
%Forms line y = Ct + D to get ready to plot tleft = min(data2(:,1)); tright = max(data2(:,1)); t = linspace(tleft, tright, 100); y = C.*t.^2 + D*t + E;
%PLots the result in the appropriate formatting plot(data2(:,1),data2(:,2),'r*', t,y,'k') legend('data','line of best fit','Location','NorthWest') fprintf('The line of best fit is y = %ft + %f. ',C, D) end
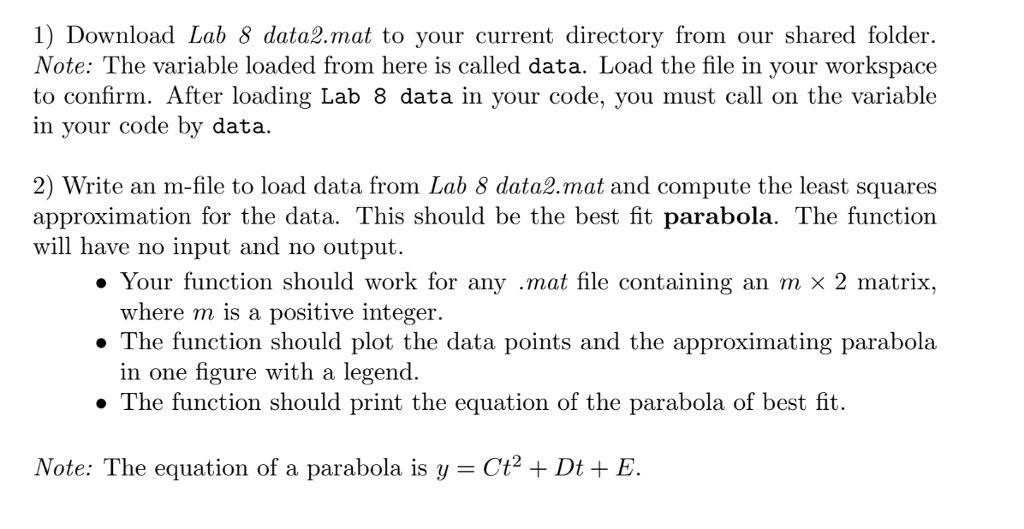
1) Download Lab 8 data2.mat to your current directory from our shared folder. Note: The variable loaded from here is called data. Load the file in your workspace to confirm. After loading Lab 8 data in your code, you must call on the variable in your code by data. 2) Write an m-file to load data from Lab 8 data2.mat and compute the least squares approximation for the data. This should be the best fit parabola. The function will have no input and no output. Your function should work for any .mat file containing an m 2 matrix. where m is a positive integer The function should plot the data points and the approximating parabola in one figure with a legend. The function should print the equation of the parabola of best fit. Note: The equation of a parabola is y = Ct2 + D1+ E. 1) Download Lab 8 data2.mat to your current directory from our shared folder. Note: The variable loaded from here is called data. Load the file in your workspace to confirm. After loading Lab 8 data in your code, you must call on the variable in your code by data. 2) Write an m-file to load data from Lab 8 data2.mat and compute the least squares approximation for the data. This should be the best fit parabola. The function will have no input and no output. Your function should work for any .mat file containing an m 2 matrix. where m is a positive integer The function should plot the data points and the approximating parabola in one figure with a legend. The function should print the equation of the parabola of best fit. Note: The equation of a parabola is y = Ct2 + D1+ E
Step by Step Solution
There are 3 Steps involved in it

Get step-by-step solutions from verified subject matter experts