

Question: i need an answer Asap . Q. explain who it might be used for policy analysis in your case. Support your answer with practical advices
i need an answer Asap . 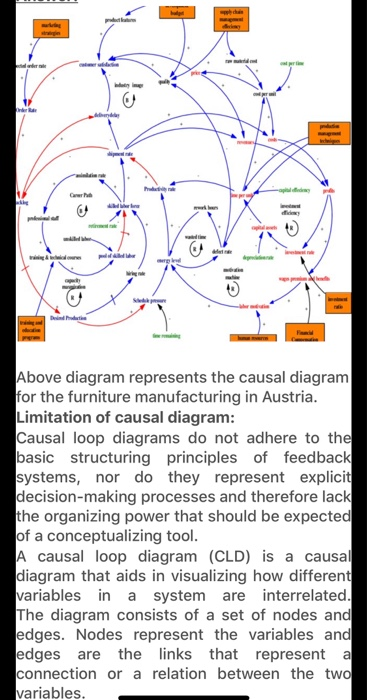
Q. explain who it might be used for policy analysis in your case. Support your answer with practical advices for the successful application .
causal diagram :
about :
Step by Step Solution
There are 3 Steps involved in it
1 Expert Approved Answer
Step: 1 Unlock

Question Has Been Solved by an Expert!
Get step-by-step solutions from verified subject matter experts
Step: 2 Unlock
Step: 3 Unlock