

Question: I need an explanation for if it's appropriate yo make a scatter chart to display the relationship between the franchise number and average u it
I need an explanation for if it's appropriate yo make a scatter chart to display the relationship between the franchise number and average u it purchase.

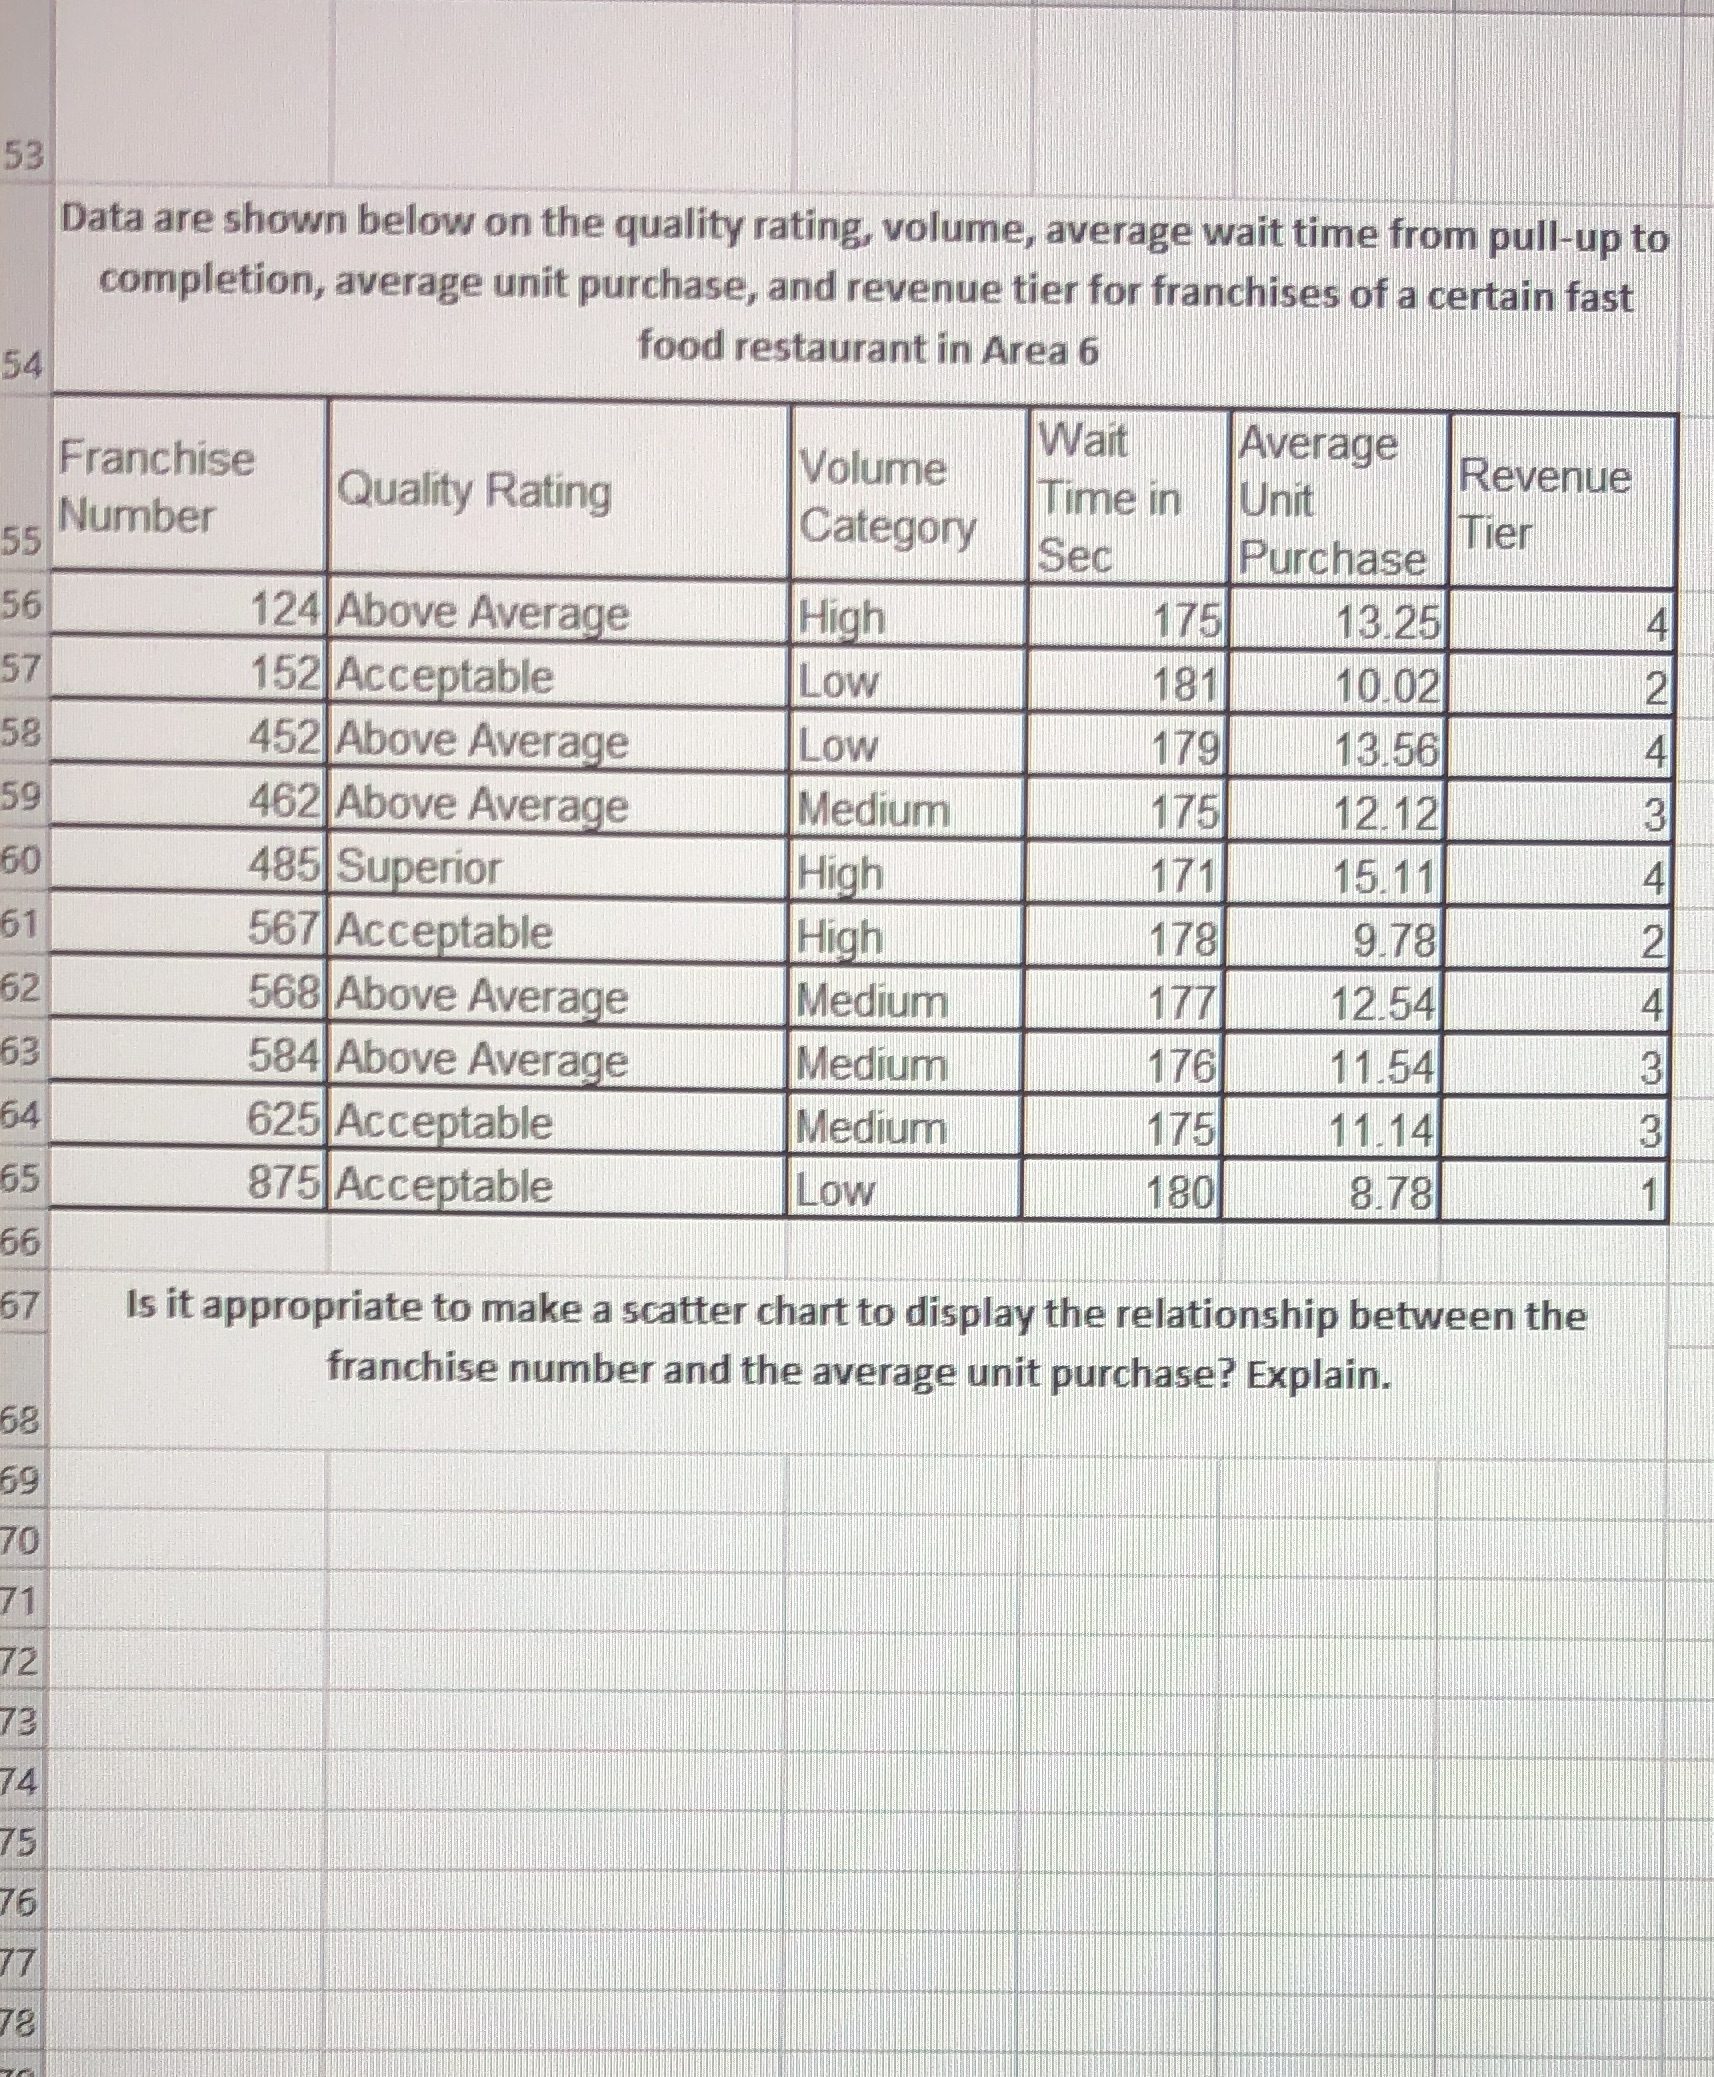
53 Data are shown below on the quality rating, volume, average wait time from pull-up to completion, average unit purchase, and revenue tier for franchises of a certain fast 54 food restaurant in Area 6 Franchise Wait Quality Rating Volume Average Time in Revenue Number Unit 55 Category Sec Purchase Tier 56 124 Above Average High 175 13.25 57 152 Acceptable Low 181 10.02 58 452 Above Average Low 179 13.56 462 Above Average Medium 175 12.12 3 60 485 Superior High 171 15.11 61 567 Acceptable High 178 9.78 62 568 Above Average Medium 177 12.54 584 Above Average Medium 176 11.54 64 625 Acceptable Medium 175 11. 14 3 65 875 Acceptable Low 180 8.78 66 67 Is it appropriate to make a scatter chart to display the relationship between the franchise number and the average unit purchase? Explain. 58 69 70 71 12 73 74 75 76 77
Step by Step Solution
There are 3 Steps involved in it

Get step-by-step solutions from verified subject matter experts