

Question: Data are shown below on the quality rating, volume, average wait time from pull-up to completion, average unit purchase, and revenue tier for franchises of
Data are shown below on the quality rating, volume, average wait time from pull-up to completion, average unit purchase, and revenue tier for franchises of a certain fast-food restaurant in Area 6.
A. Is it appropriate to make a scatter chart to display the relationship between the franchise number and the average unit purchase? Explain.
B. What types of charts do you suggest to develop to visualize the data set?
C. What possible findings can you obtain from this data set?
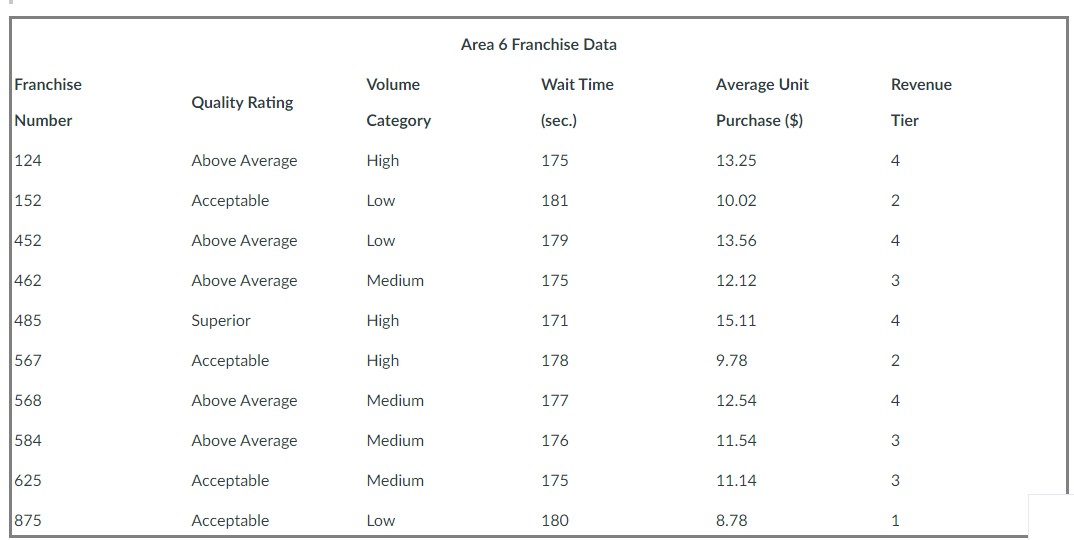
Area 6 Franchise Data Franchise Quality Rating Volume Wait Time Average Unit Revenue Number Category (sec.) Purchase (\$) Tier 124 Above Average High 175 Acceptable Low Above Average Low Above Average Medium Superior High Acceptable High Above Average Medium Above Average Medium Acceptable Medium Acceptable Low 180 15.11 4 2 875
Step by Step Solution
There are 3 Steps involved in it

Get step-by-step solutions from verified subject matter experts