

Question: I need answer urgently for this question. Please help me. Thank you. Q1 Gantt chart is one of the useful ways of showing a project
I need answer urgently for this question. Please help me.
Thank you.
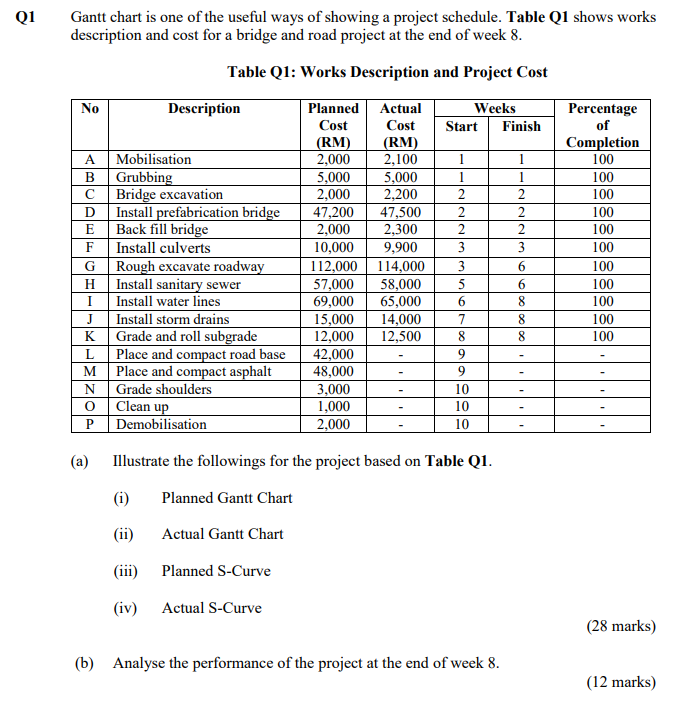
Q1 Gantt chart is one of the useful ways of showing a project schedule. Table Q1 shows works description and cost for a bridge and road project at the end of week 8. Table Q1: Works Description and Project Cost No Description Planned Actual Weeks Percentage Cost Cost Start Finish of (RM) (RM) Completion A Mobilisation 2,000 2,100 1 1 100 B Grubbing 5,000 5,000 100 C Bridge excavation 2,000 2,200 00 D Install prefabrication bridge 47,200 47,500 2 100 E Back fill bridge 2,000 2,300 100 F Install culverts 10,000 9.900 3 100 G Rough excavate roadway 112,000 114,000 6 00 H Install sanitary sewer 57,000 58,000 00 I Install water lines 69,000 65,000 100 J Install storm drains 15,000 14,000 100 K Grade and roll subgrade 12,000 12,500 8 8 100 L. Place and compact road base 42,000 9 M Place and compact asphalt 48,000 9 N Grade shoulders 3.000 10 O Clean up 1,000 10 P Demobilisation 2,000 (a) Illustrate the followings for the project based on Table Q1. (i) Planned Gantt Chart (ii) Actual Gantt Chart (iii) Planned S-Curve (iv) Actual S-Curve (28 marks) (b) Analyse the performance of the project at the end of week 8. (12 marks)
Step by Step Solution
There are 3 Steps involved in it

Get step-by-step solutions from verified subject matter experts