

Question: I need help also finding Lower control limit (LCL;) = b) What are the upper and lower coltirol limits of the 3-sigma range chart? Upper
I need help also finding 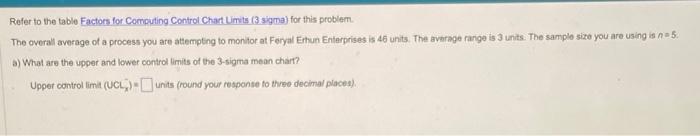
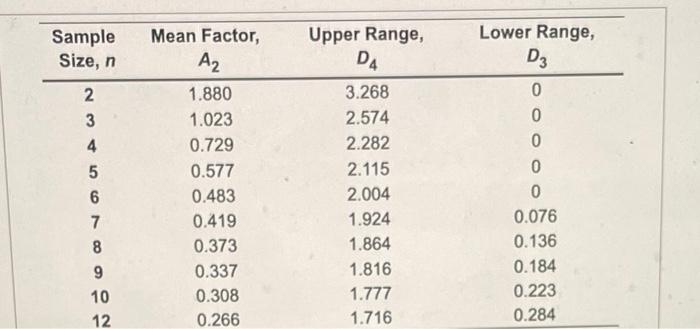
Refer to the table Factors for Computing Control Chat Limits (3 sigma) for this problem. The overall average of a process you are attempting to monitor at Feryal Erthun Enterprises is 46 units. The avarage range is 3 units. The samplo size you are using is n=5. a) What are the upper and lower control limits of the 3-sigma mean chart? Upper control limit (UCLx)= units (round your response to threo decimal places). \begin{tabular}{cccc} \hline Sample & Mean Factor, & Upper Range, & Lower Range, \\ Size, n & A2 & D4 & D3 \\ \hline 2 & 1.880 & 3.268 & 0 \\ 3 & 1.023 & 2.574 & 0 \\ 4 & 0.729 & 2.282 & 0 \\ 5 & 0.577 & 2.115 & 0 \\ 6 & 0.483 & 2.004 & 0 \\ 7 & 0.419 & 1.924 & 0.076 \\ 8 & 0.373 & 1.864 & 0.136 \\ 9 & 0.337 & 1.816 & 0.184 \\ 10 & 0.308 & 1.777 & 0.223 \\ 12 & 0.266 & 1.716 & 0.284 \\ \hline \end{tabular} Lower control limit (LCL;) =
b) What are the upper and lower coltirol limits of the 3-sigma range chart?
Upper control limit (UCLp)=
Lower control limit (LCLp) =
Step by Step Solution
There are 3 Steps involved in it
1 Expert Approved Answer
Step: 1 Unlock

Question Has Been Solved by an Expert!
Get step-by-step solutions from verified subject matter experts
Step: 2 Unlock
Step: 3 Unlock