

Question: I need help analyzing and computing the data found in the attached spreadsheet. 11.1 The table showing the stock price changes for a sample of


I need help analyzing and computing the data found in the attached spreadsheet. 11.1
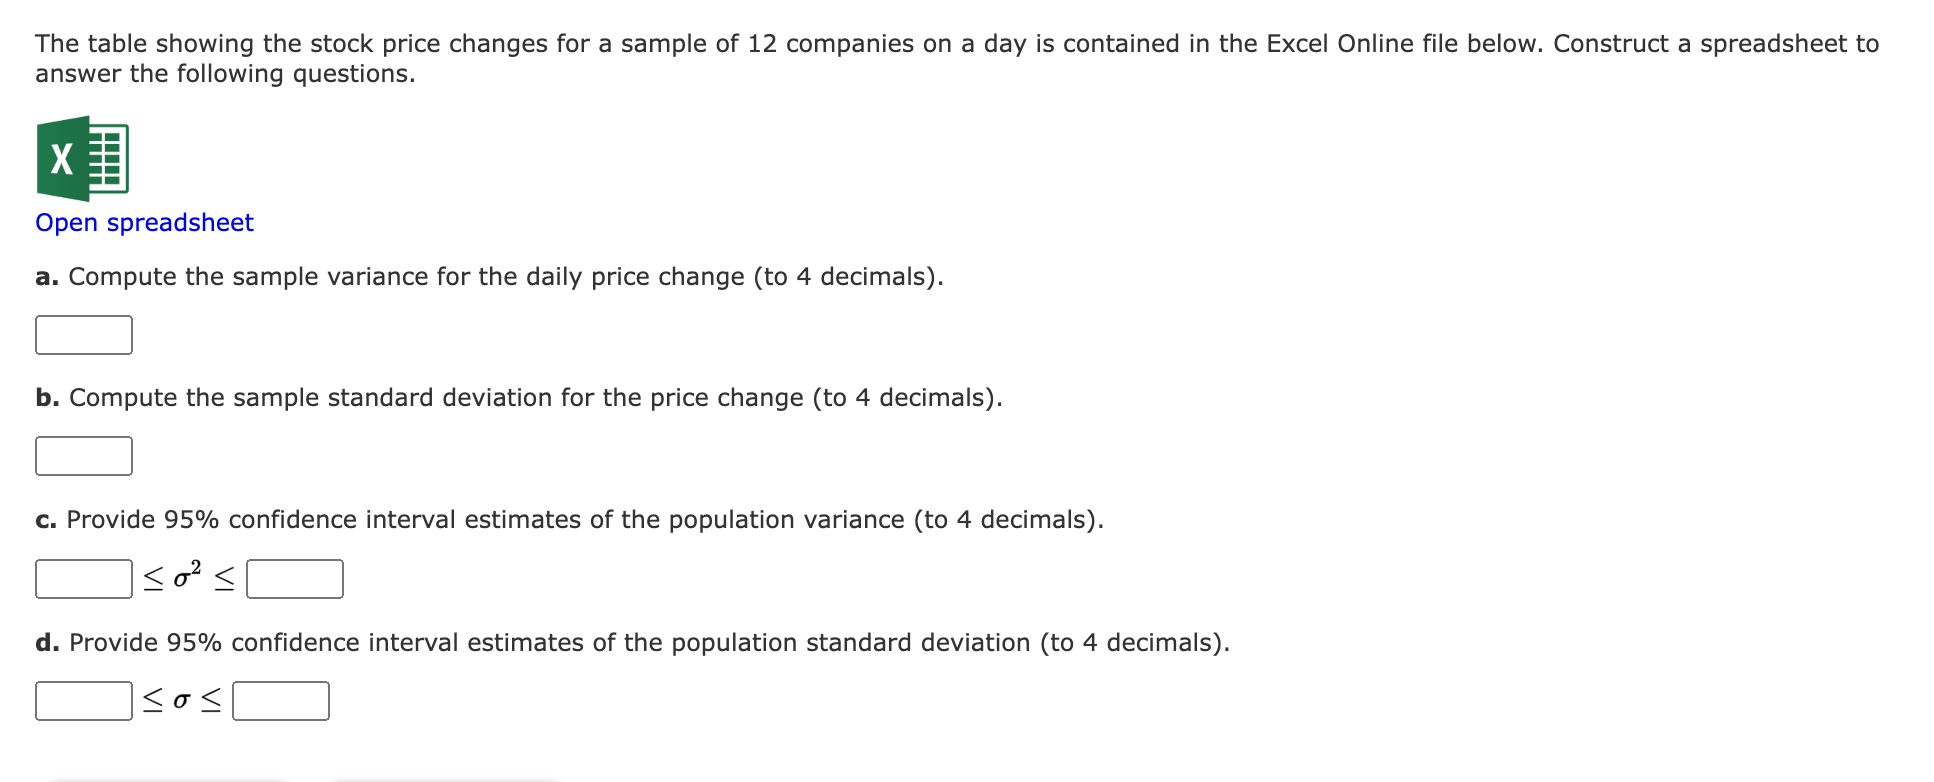
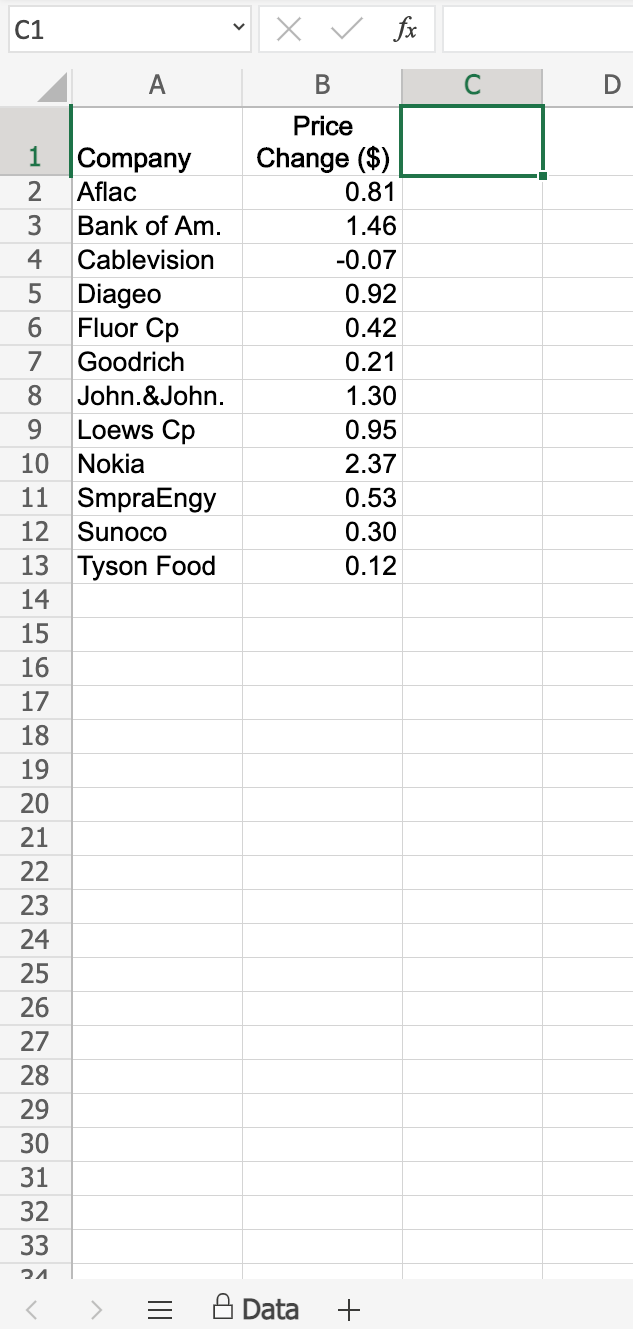
The table showing the stock price changes for a sample of 12 companies on a day is contained in the Excel Online file below. Construct a spreadsheet to answer the following questions. Open spreadsheet a. Compute the sample variance for the daily price change (to 4 decimals). b. Compute the sample standard deviation for the price change (to 4 decimals). c. Provide 95% confidence interval estimates of the population variance (to 4 decimals). _St72$:] d. Provide 95% confidence interval estimates of the population standard deviation (to 4 decimals). S03
Step by Step Solution
There are 3 Steps involved in it
1 Expert Approved Answer
Step: 1 Unlock

Question Has Been Solved by an Expert!
Get step-by-step solutions from verified subject matter experts
Step: 2 Unlock
Step: 3 Unlock