

Question: I need help analyzing and computing the data found in the attached spreadsheet. (3.4A1) G H L E F I J K M Men Women


I need help analyzing and computing the data found in the attached spreadsheet. (3.4A1)
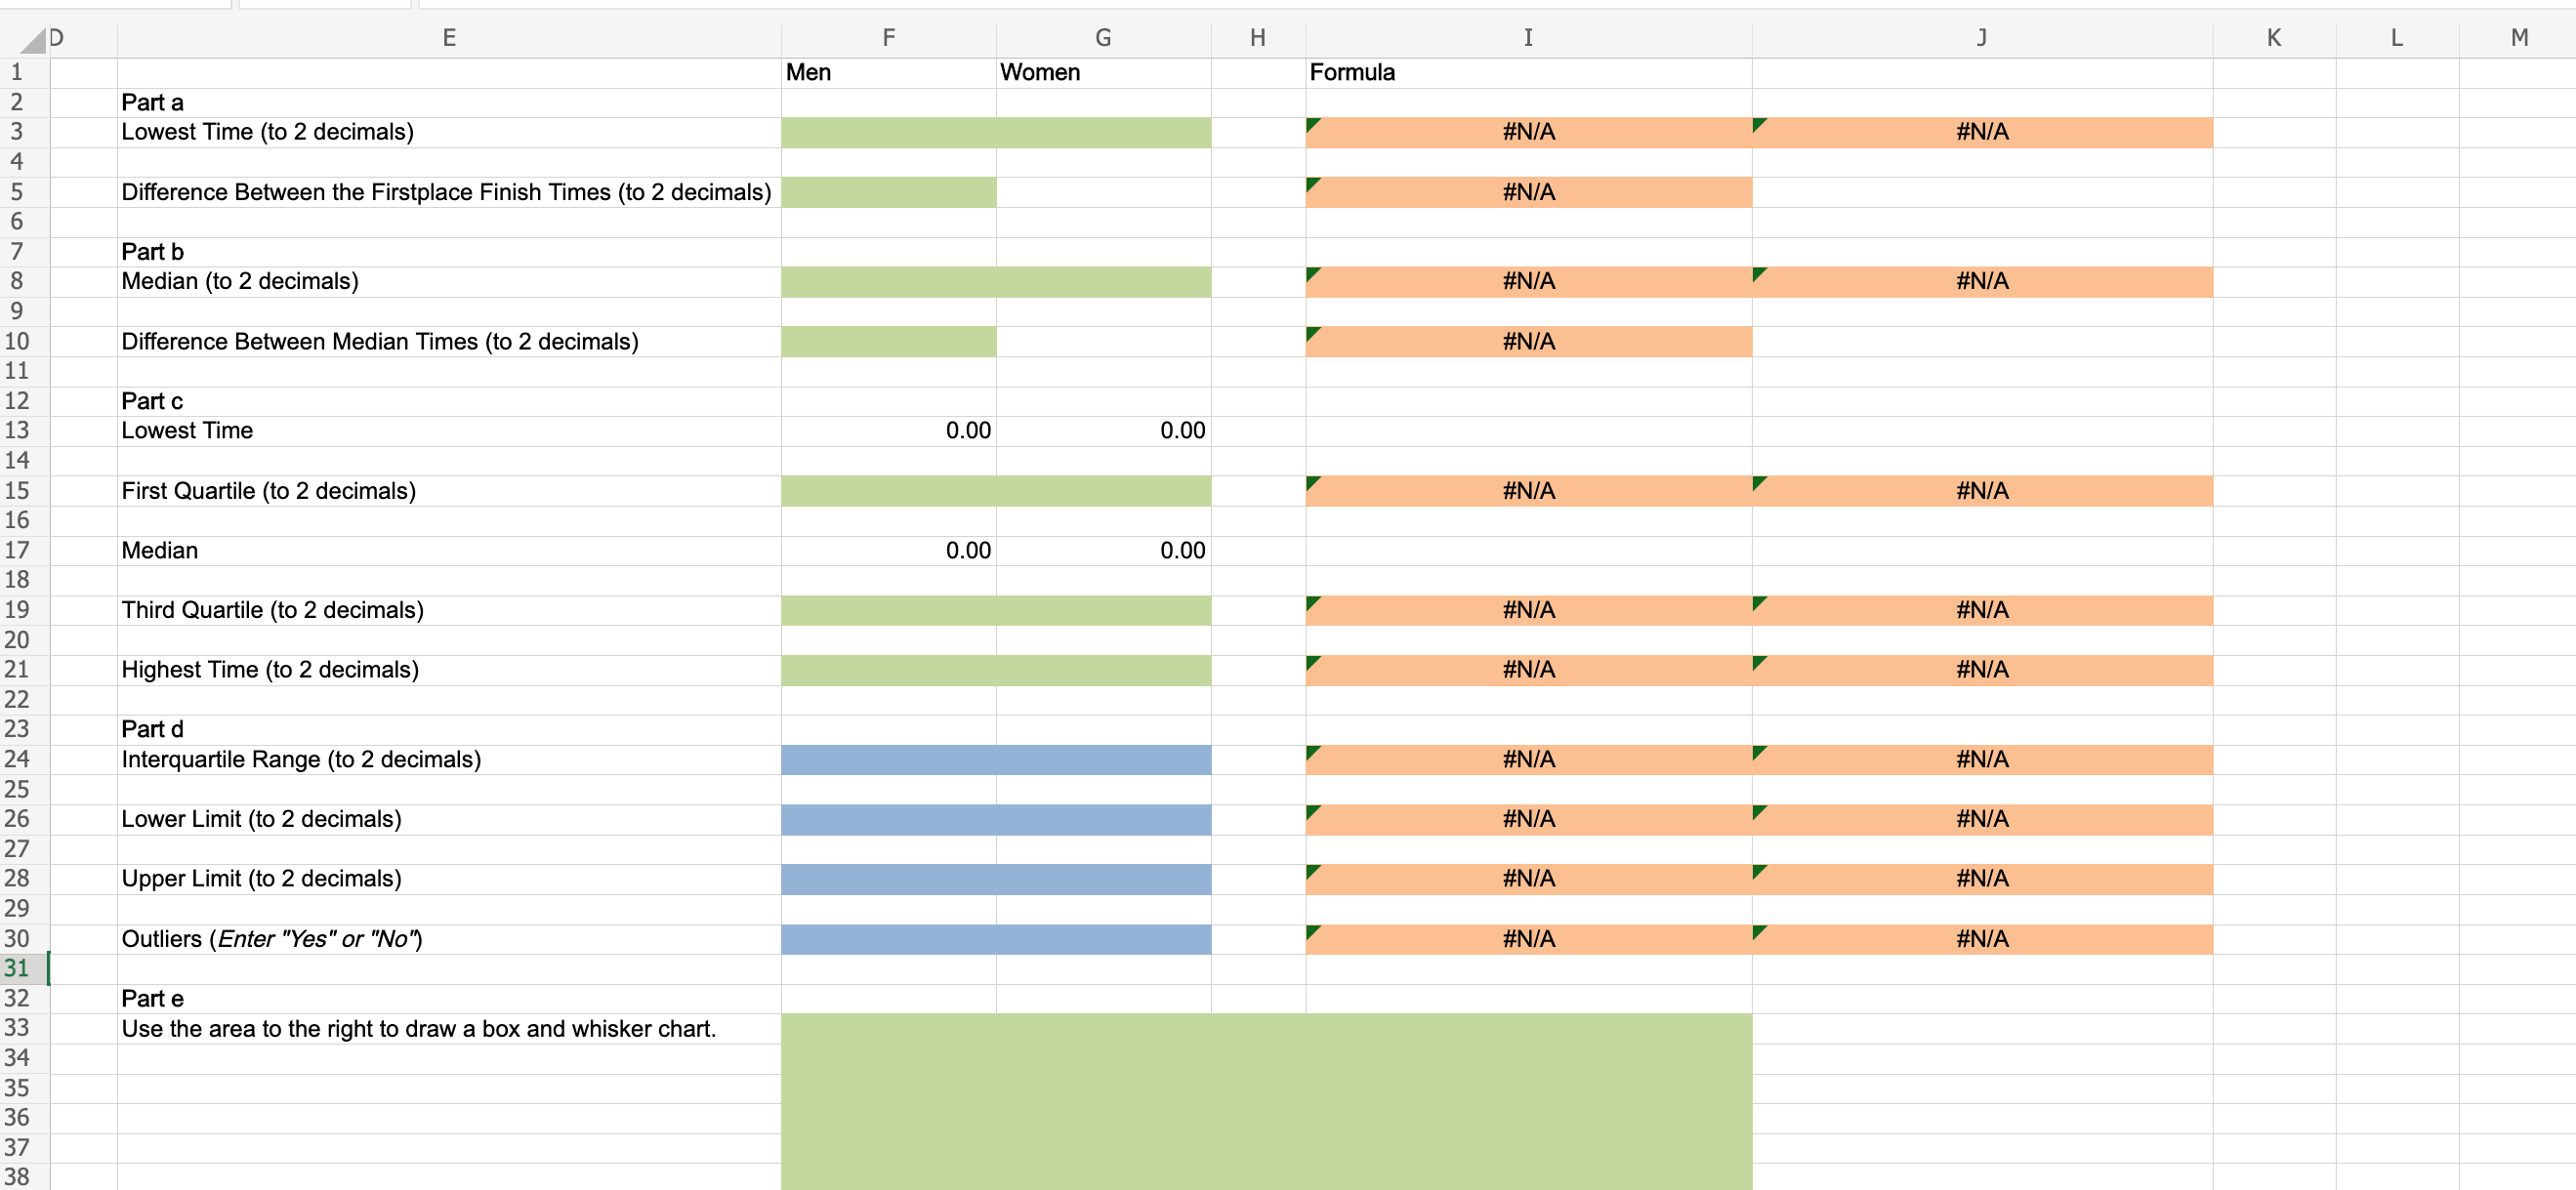
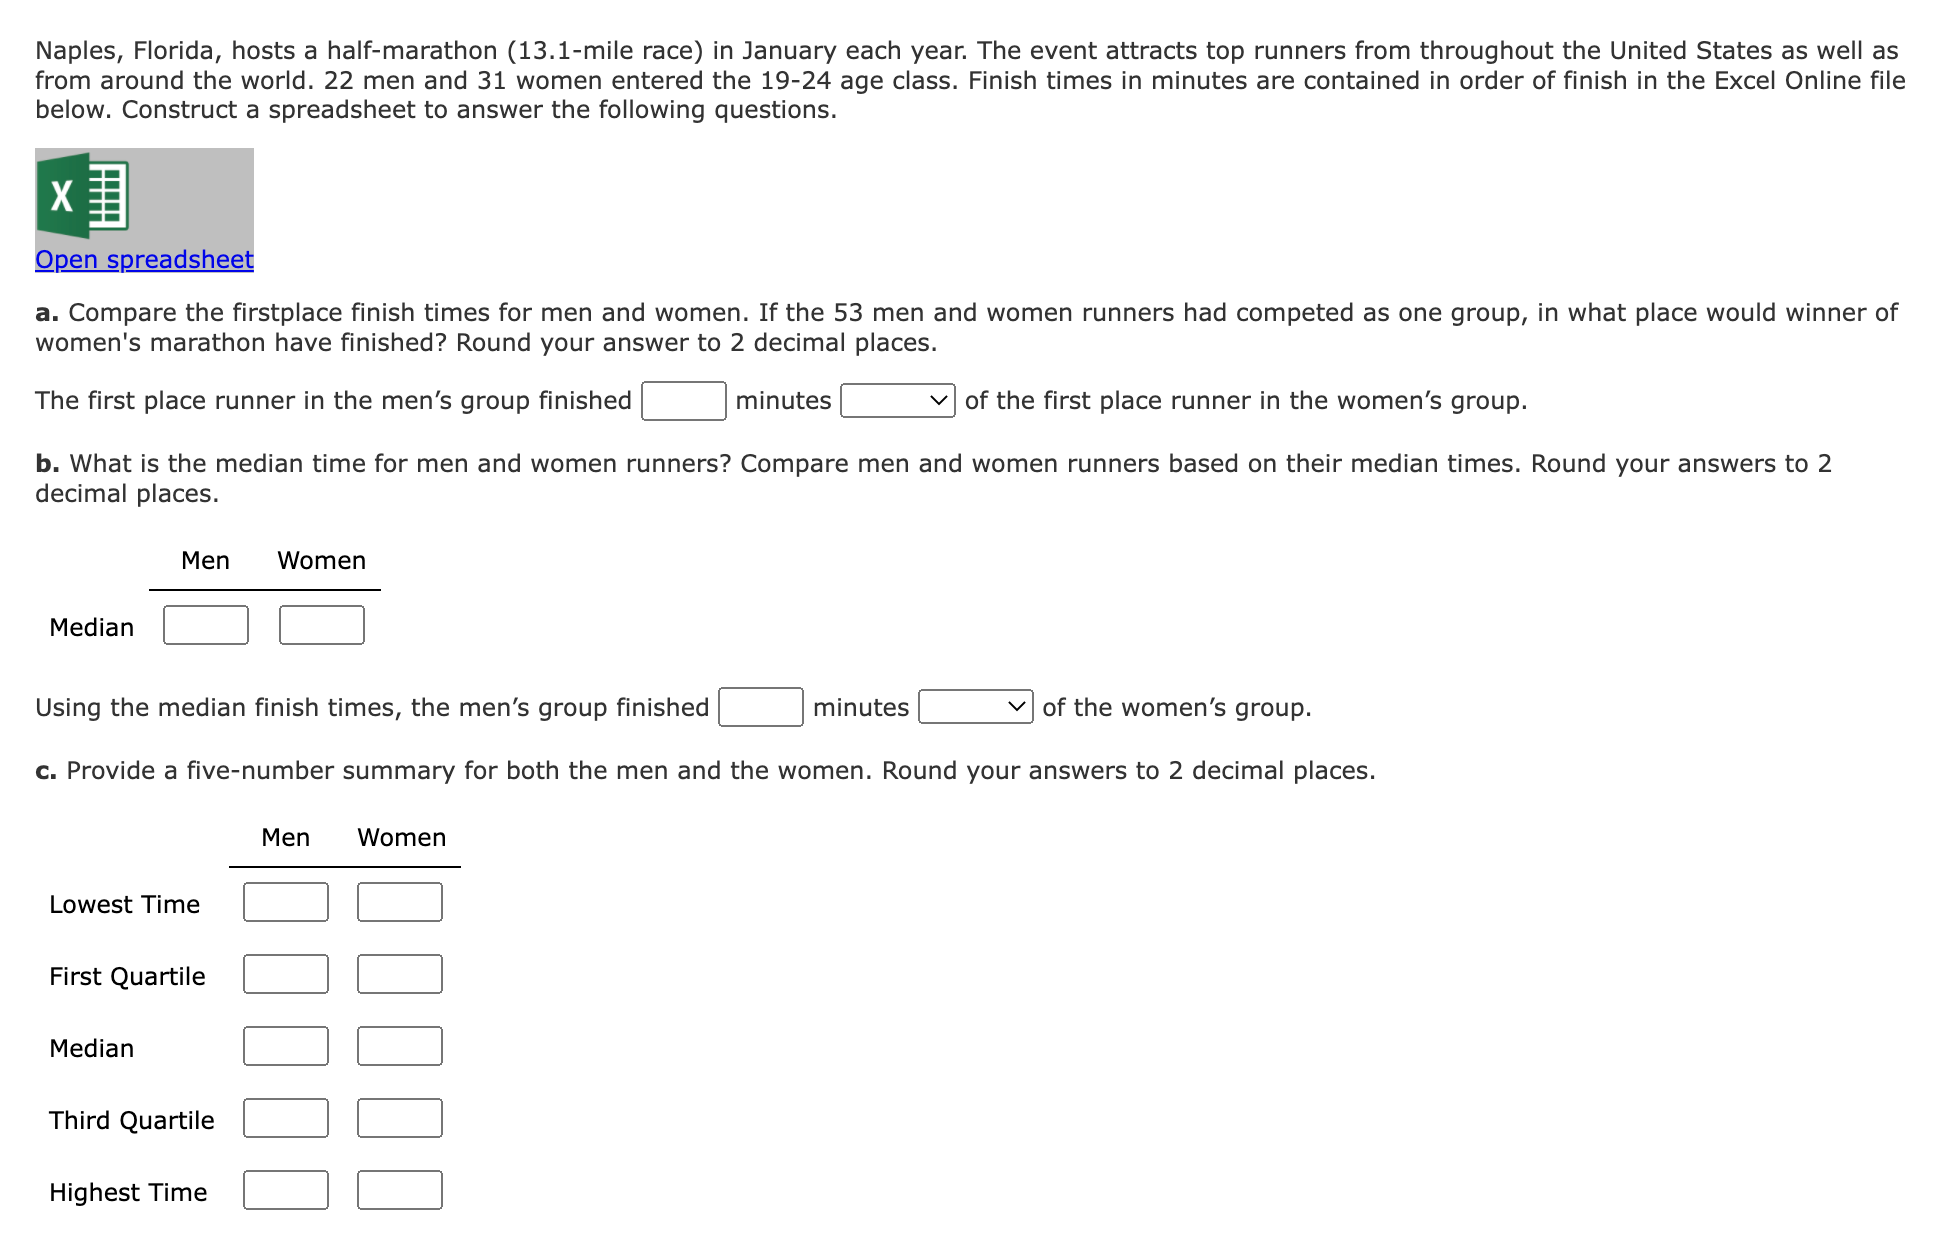

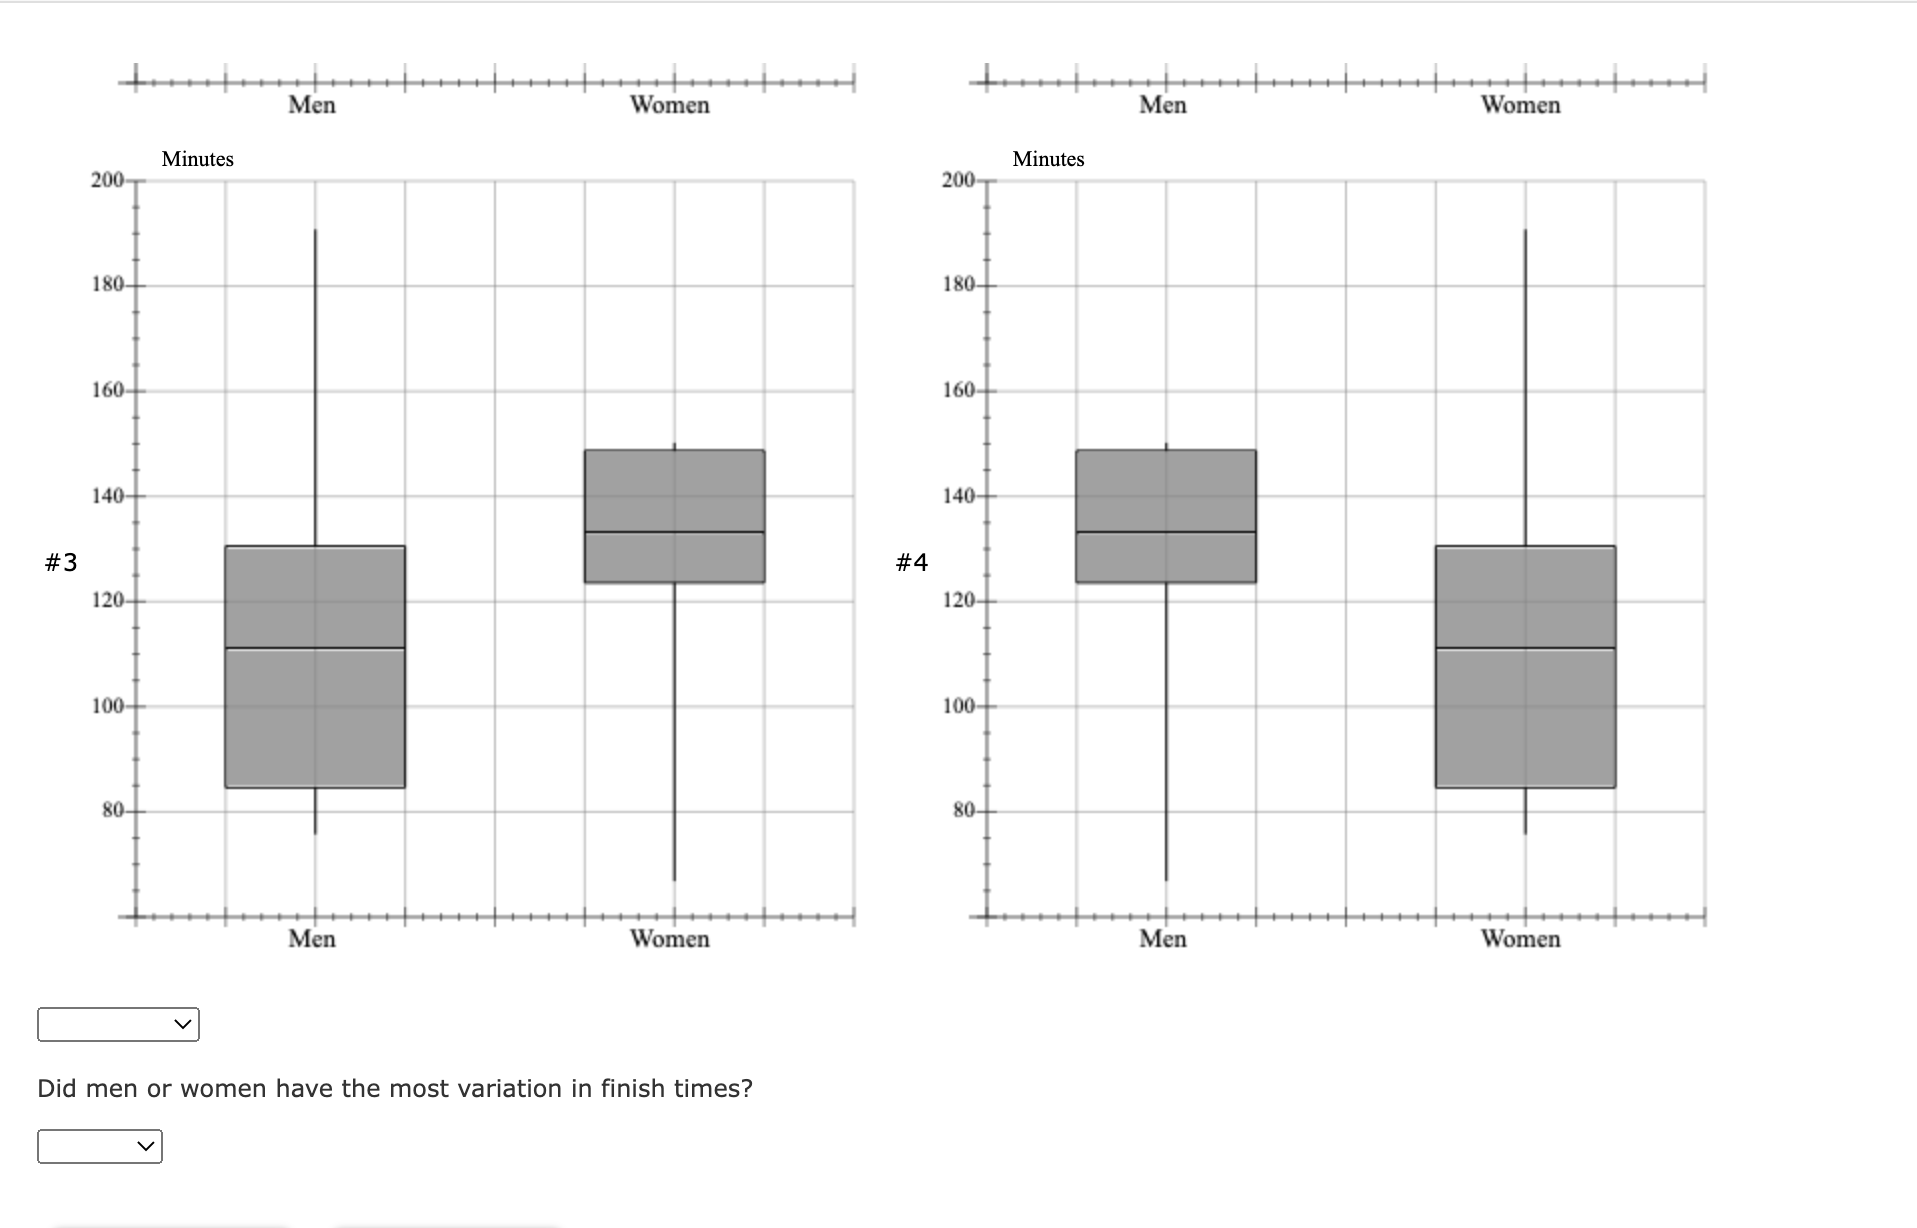
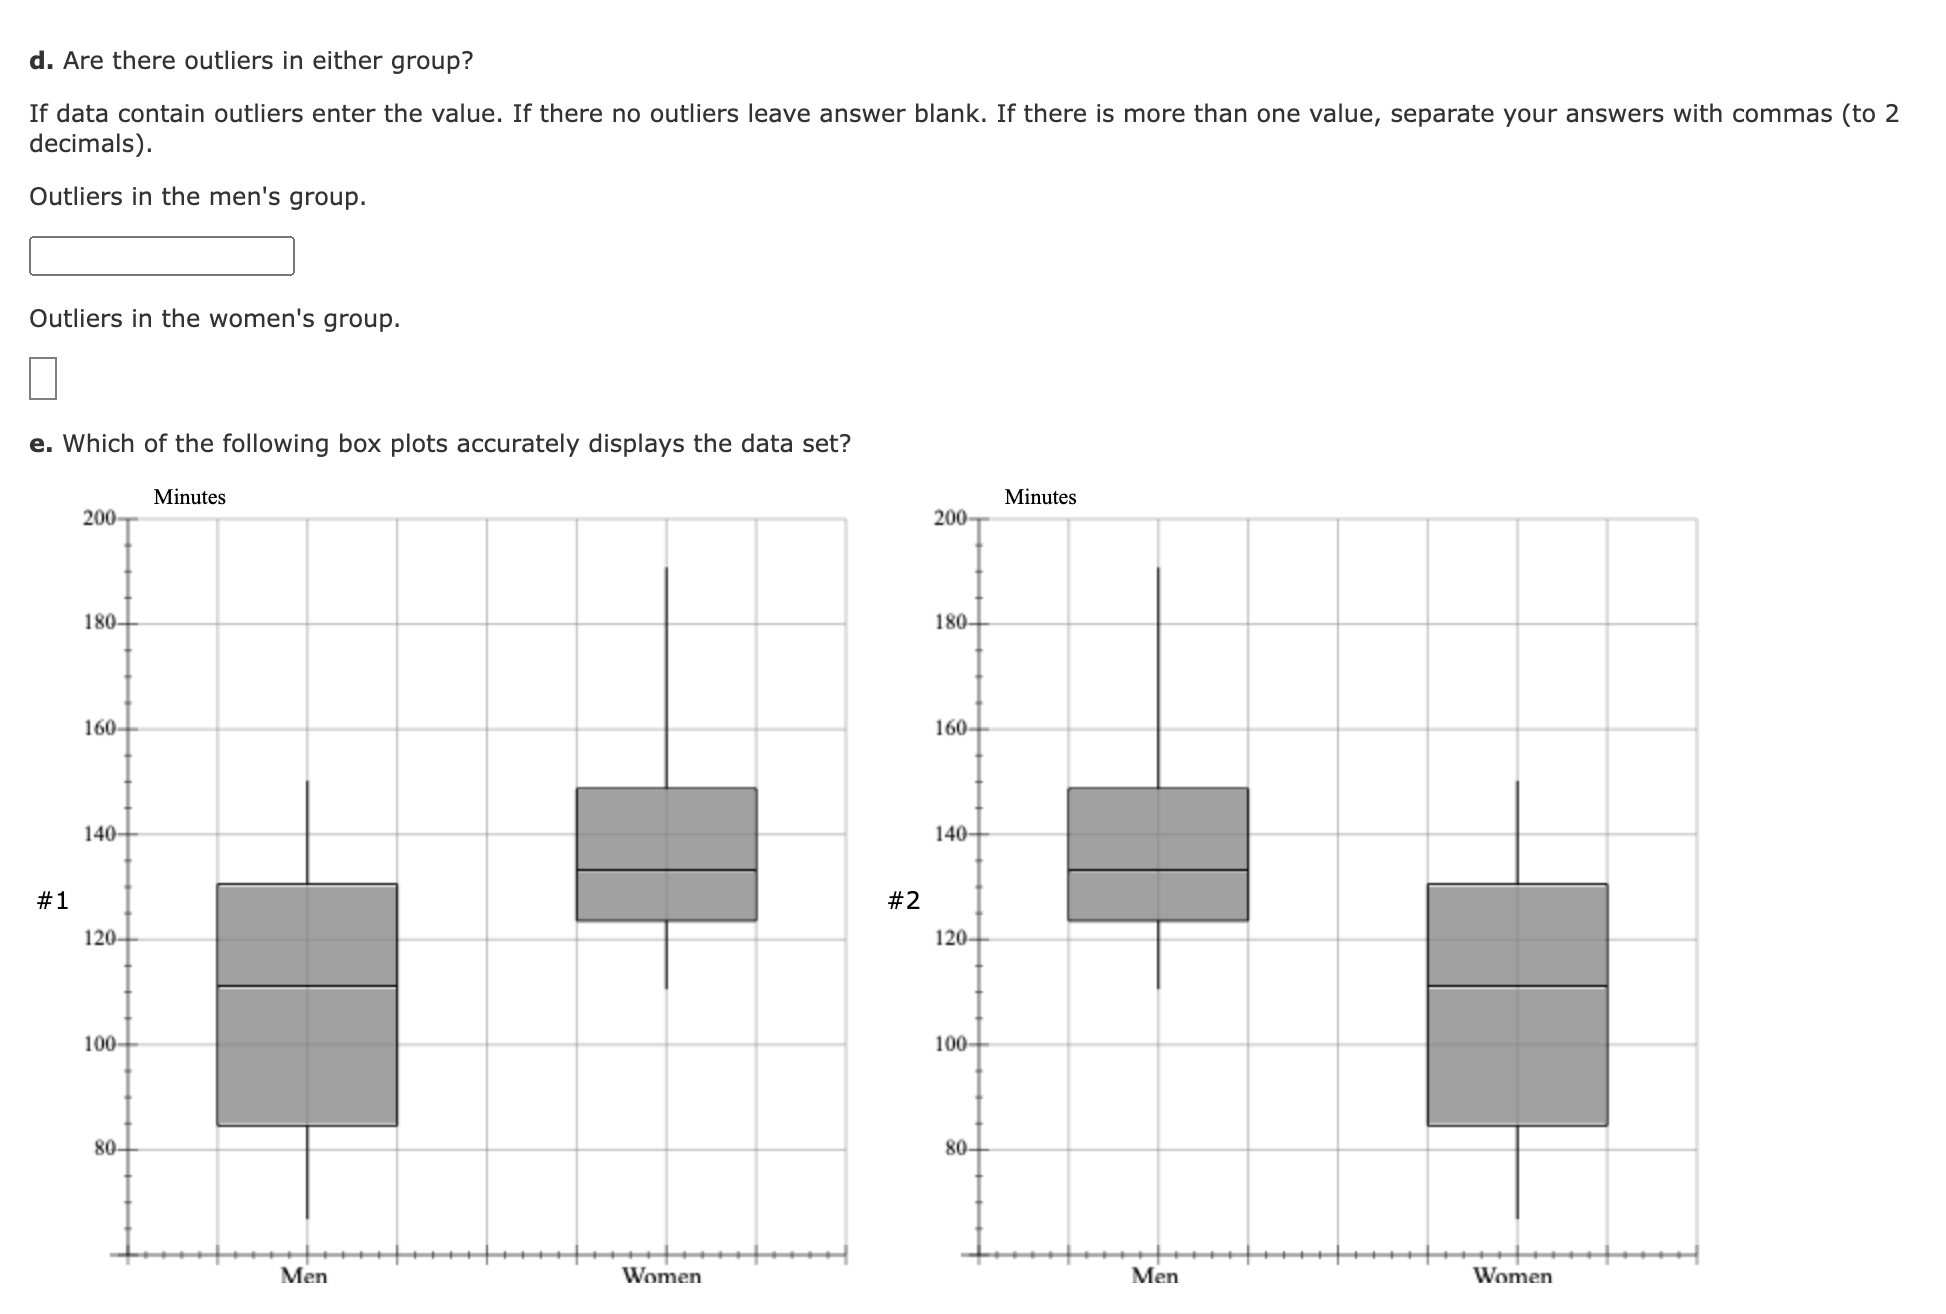
G H L E F I J K M Men Women Formula Part a Lowest Time (to 2 decimals) #N/A #N/A Difference Between the Firstplace Finish Times (to 2 decimals) #N/A Part b Median (to 2 decimals) #N/A #N/A Difference Between Median Times (to 2 decimals) #N/A 11 Part c 13 Lowest Time 0.00 0.00 15 First Quartile (to 2 decimals) #N/A #N/A 16 17 Median 0.00 0.00 18 #N/A #N/A 19 Third Quartile (to 2 decimals) 20 21 Highest Time (to 2 decimals) #N/A #N/A 22 Part d 24 Interquartile Range (to 2 decimals) #N/A #N/A 25 26 Lower Limit (to 2 decimals) #N/A #N/A Upper Limit (to 2 decimals) #N/A #N/A 28 29 Outliers (Enter "Yes" or "No") #N/A #N/A 30 31 32 Part e 33 Use the area to the right to draw a box and whisker chart. 34 35 36 37 38Naples, Florida, hosts a half-marathon (13.1-mile race) in January each year. The event attracts top runners from throughout the United States as well as from around the world. 22 men and 31 women entered the 19-24 age class. Finish times in minutes are contained in order of nish in the Excel Online le below. Construct a spreadsheet to answer the following questions. XE 3. Compare the firstplace nish times for men and women. If the 53 men and women runners had competed as one group, in what place would winner of women's marathon have nished? Round your answer to 2 decimal places. The first place runner in the men's group finished C] minutes v of the first place runner in the women's group. b. What is the median time for men and women runners? Compare men and women runners based on their median times. Round your answers to 2 decimal places. Men Women Median Using the median finish times, the men's group nished C] minutes of the women's group. c. Provide a five-number summary for both the men and the women. Round your answers to 2 decimal places. Men Women Lowest Time First Quartile Median Third Quartile Highest Time d. Are there outliers in either group? If data contain outliers enter the value. If there no outliers leave answer blank. If there is more than one value, separate your answers with commas (to 2 decimals). Outliers in the men's group. Outliers in the women's group. e. Which of the following box plots accurately displays the data set? Minutes Minutes 200- 200- 180- 180- 160- 160- 140- 140- # 1 # 2 120 120- 100- 100- 80- 80- Men Women Men WomenMen Women Men Women Minutes 200- Minutes 200- 180- 180- 160- 160- 140- 140- #3 #4 120- 120 100- 100- 80- 80- Men Women Men Women Did men or women have the most variation in finish times
Step by Step Solution
There are 3 Steps involved in it

Get step-by-step solutions from verified subject matter experts