

Question: I need help figuring out how to do the benchmark ratios and maybe you could help me with other parts of the project. below I
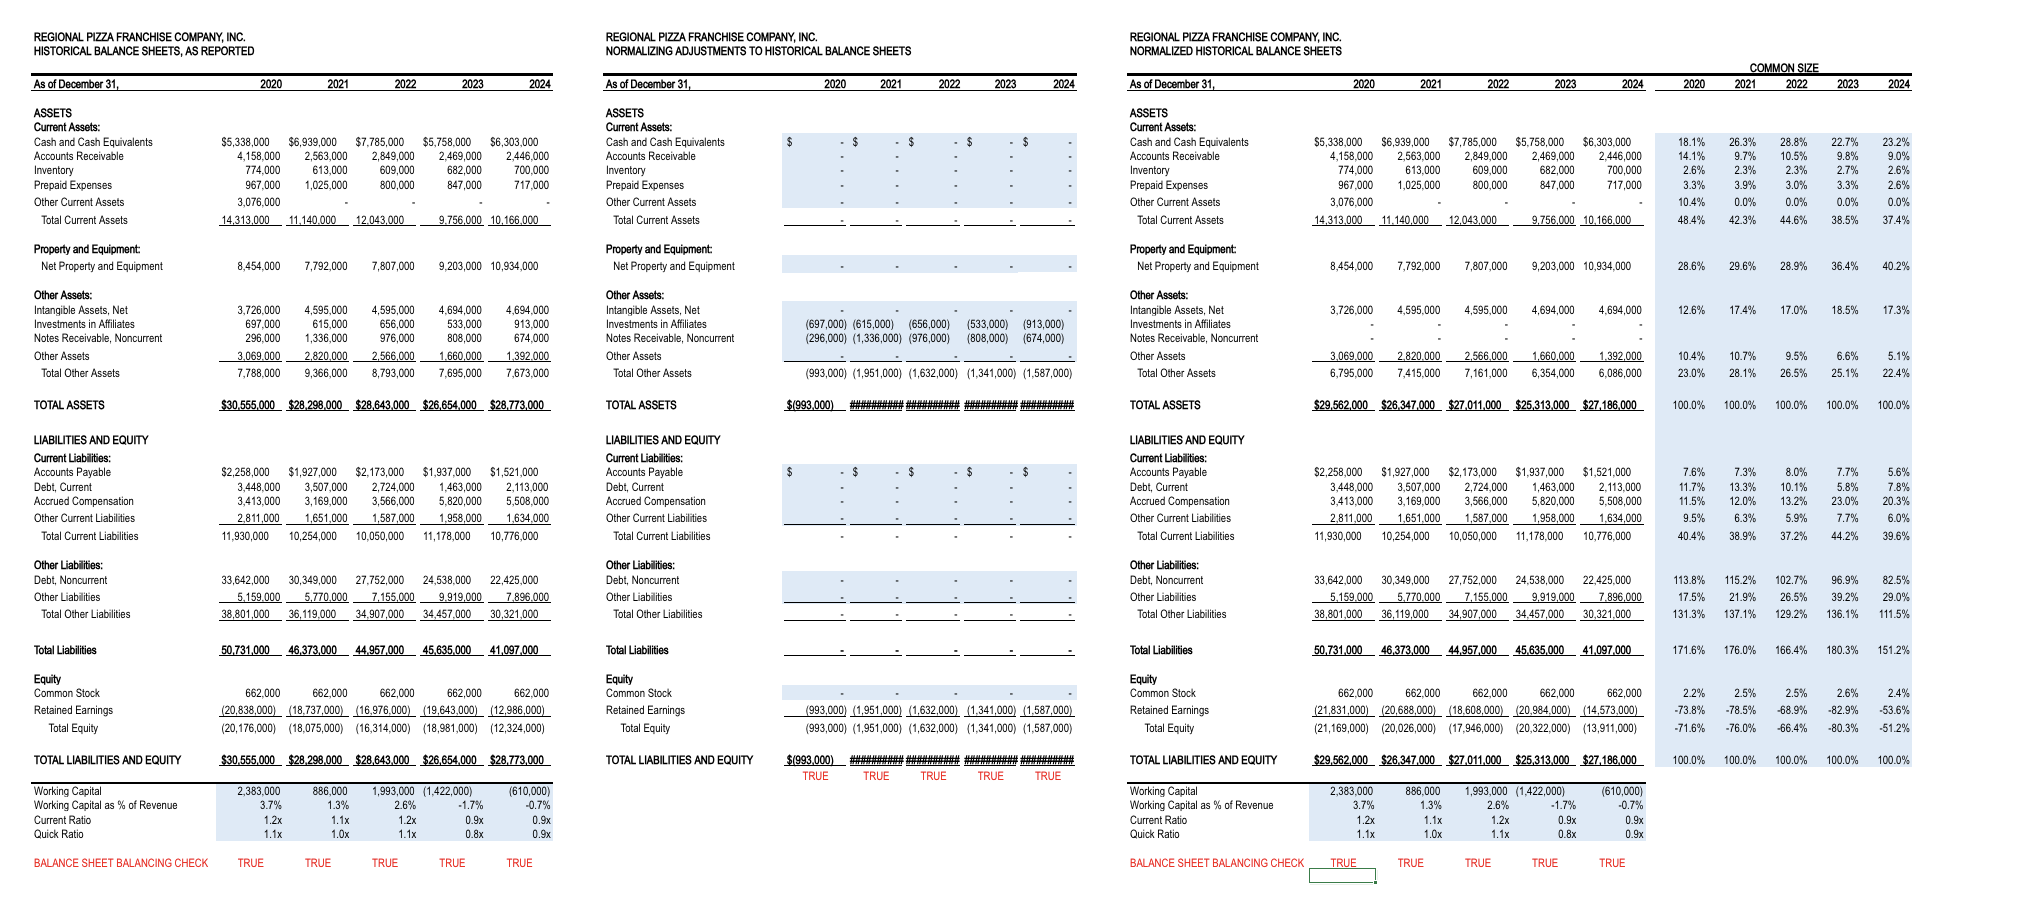
I need help figuring out how to do the benchmark ratios and maybe you could help me with other parts of the project. below I will add the outline for the project, fun facts for the company that we are doing, and a WACC pdf with the other companies we are comparing to REGIONAL PIZZA FRANCHISE COMPANY, INC. RPFC or the Company Background RPFC is an operator and franchisor of family oriented pizzeria restaurants with locations in the following states: Alaska, Arizona, California, Hawaii, Nevada, Oregon, and Washington. As of December Valuation Date the Company also had ten international stores. The Companys restaurants offer specialty pizzas, along with appetizers, salads, and sandwiches. Based on its latest annual gross revenue, RPFC was one of the largest pizza franchise firms in the US The Company is a Subchapter S Corporation. The principal activities of the Company are franchising its Pizza Brand restaurants and operating Companyowned Pizza Brand restaurants. The Company had stores as of the Valuation Date, of which were Companyowned and were franchised. The Company had approximately employees. The Companys typical restaurant is approximately square feet and located near a big box shopping center, which serves as an anchor for the store location. The Company has a member board of directors and an experienced management team. The Companys competitors fall into three groups. The first group represents independentmomandpop" pizza restaurants, and accounts for approximately onehalf of the volume in this category nationwide. This group continues to decline. The second group includes branded national chains. Brands include Pizza Hut, Dominos Papa Johns Papa Murphys Pizza, and Little Caesars in the Western US and primarily or exclusively compete for takeout and delivery pizza sales, not dinein sales. The third group of competitors in the Western US includes regional brands like Shakeys and Straw Hat that are primarily focused on dinein Following many years of store count decline, these brands have remained relatively flat in their store counts. Management indicated that the Company benchmarks its performance against the following set of companies: Papa Johns NasdaqGS: PZZA Brinker International NYSE: EAT BJs Restaurants, Inc. NasdaqGS: BJRI and Red Robin Gourmet Burgers Inc. NasdaqGS: RRGB Historical Financial Statement Items Requiring Adjustments Management indicated that Investments in Affiliates and Noncurrent Notes Receivable were nonoperating assets; Reported annual ESOP expenses represent a discretionary item that needs to be replaced with a normalized annual pension benefit expense of $; Reported Discontinued Operations, Restructuring Charges and Store Closure Expenses represent nonrecurring costs; Pretax income should be taxed using the income tax rate of which represents the Federal corporate income tax of and California State corporate income tax of Projected Results of Operations Items Requiring Adjustments Projected annual ESOP Expenses represent a discretionary item that needs to be replaced with a normalized annual pension benefit expense of $ that changes with the projected annual changes in Income from Operations; Projected pretax income should be taxed using the income tax rate of Other Information Management projected CAPEX of $ million in and $ million annually thereafter. In the past, the Company acquired franchisee restaurant operations at the LTM EBITDA multiples ranging between x and x and LTM EBIT multiples ranging between x and x Industry research indicated that in the last years, the public companies in the industry had generally been acquired at a premium to their stock prices prior to announcement of acquisitions. A day control premium has ranged from to with a median of We are evaluating a regional pizza franchise company, with a subject interest of equity, and our purpose is tax. Ratio analysis based on normalized results of operations; Market Approach Guideline Public Company Method: Income Approach whoever can help us we need help with the ratio analysis page, and the market approach. we need to do a market approach and income approach. The benchmark ratios we are confused about cause we need to use the WACC paper which has the other companies we are comparing our regional pizza franchise to any help will be great. above in this chat is the facts that we need to use to answer some of the excel papers
Step by Step Solution
There are 3 Steps involved in it
1 Expert Approved Answer
Step: 1 Unlock

Question Has Been Solved by an Expert!
Get step-by-step solutions from verified subject matter experts
Step: 2 Unlock
Step: 3 Unlock