

Question: i need help please Variance and standard deviation Calculate the variance and the standard deviation of US Treasury bills, long term government bonds, and m.company
 i need help please
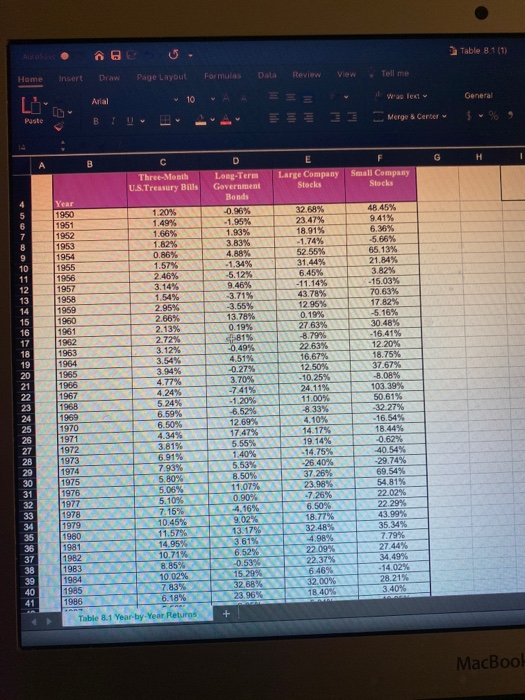
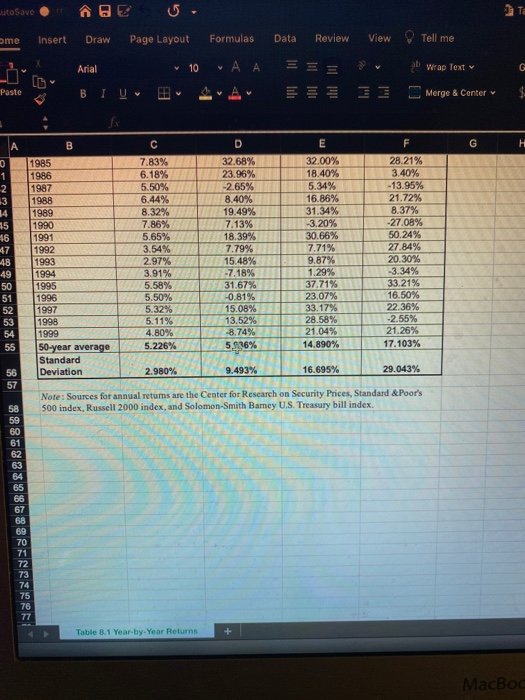
Variance and standard deviation Calculate the variance and the standard deviation of US Treasury bills, long term government bonds, and m.company looks for 1960 to 1958, 1960 1969 1970 to 1979, and 1990 to 1 from Table 8.1. Which had the highest variance? Which had the lowest variance? Click on the Spreadsheet Learning Aid to see Table 8. 1-Year by Year Returns, 1950 1999 Het Make sure to round liemediate cloutions to sto seven () decimal place. The input instructions.phases in parenthesis ter each box, only apply for the answers you will type What is the rice U.S. Treasury bills for 1860 to 1959 1960 to 1908. 1970 to 1979, and 1980s 1980 The variance of US Treasury is for 190 to 19 (Round to five decimal places) Table 8.1 (1) Home Insert View Page Layout Draw Formulas Review Tell me Walent 10 Arial General Paste EEE 13 Merge & Center B G H B Three Month U.S.Treasury Bills E Large Company Stocks Small Company Stocks 4 5 6 7 9 10 11 12 13 14 15 16 17 18 19 20 21 22 23 24 25 26 27 28 29 30 31 32 33 34 35 36 37 38 39 40 41 Year 1950 1951 1952 1953 1954 1955 1956 1957 1958 1959 1960 1961 1962 1963 1964 1965 1966 1967 1968 1969 1970 1971 1972 1973 1974 1975 1976 1977 1978 1979 1980 1981 1982 1983 1984 1985 1986 1.20% 1.49% 1.66% 1.82% 0.86% 1.57% 2.46% 3.14% 1.54% 2.95% 2.66% 2.13% 2.72% 3.12% 3.54% 3.94% 4.77% 4.24% 5.24% 6.59% 6.50% 4.34% 3.81% 6.91% 7.93% 5.80% 5.05% 5.10% 7.15% 10.45% 11.57% 14.95% 10.71% 8.85% 10.02% 7.83% 6.18% D Long-Term Government Bonds -0.96% -1.95% 1.93% 3.83% 4.88% -1.34% -5.12% 9.46% -3.71% -3.55% 13.78% 0.19% 81% -0.49% 4.51% -0.27% 3.70% -7.41% -1.20% -6.52% 12.69% 17.47% 5.55% 1.40% 5.53% 8.50% 11.07% 0.90% 4,16% 9.02% 13.17% 3.61% 6.52% -0.53% 15 29% 32,68% 23.96% 32.68% 23.47% 18.91% -1.74% 52.55% 31.44% 6.45% -11.14% 43.78% 12.95% 0.19% 27.63% -8.79% 22.63% 16.67% 12.50% - 10.25% 24.11% 11.00% 8.33% 4.10% 14.17% 19.14% -14.75% -26.40% 37.26% 23.98% -7.26% 6.50% 18.77% 32 48% 4.98% 22.09% 22.37% 6.46% 32.00% 18.40% 48.45% 9.41% 6.36% -5.66% 65.13% 21.84% 3.82% - 15.03% 70.63% 17.82% -5.16% 30.48% -16.41% 12.20% 18.75% 37.67% -8.08% 103.39% 50.61% -32.27% -16.54% 18.44% -0.62% 40.54% 29.74% 69.54% 54,81% 22.02% 22.29% 43.99% 35.34% 7.79% 27.44% 34.49% - 14.02% 28.219 3.40% + Table 8.1 Year-by-Year Returns MacBoo! utoSave TE ame Insert Draw Page Layout Formulas Data Review View Tell me Arial 10 G ab Wrap Text Merge & Center Paste BIU EE E G H 0 1 2 13 14 15 46 47 48 49 50 51 52 53 54 55 B 1985 1986 1987 1988 1989 1990 1991 1992 1993 1994 1995 1996 1997 1998 1999 50-year average Standard Deviation C 7.83% 6.18% 5.50% 6.44% 8.32% 7.86% 5.65% 3.54% 2.97% 3.91% 5.58% 5.50% 5.32% 5.11% 4.80% 5.226% D 32.68% 23.96% -2.65% 8.40% 19.49% 7.13% 18.39% 7.79% 15.48% -7.18% 31.67% -0.81% 15.08% 13,52% -8.74% 5,496% 32.00% 18.40% 5.34% 16.86% 31.34% -3.20% 30.66% 7.71% 9.87% 1.29% 37.71% 23.07% 33.17% 28.58% 21.04% 14.890% F 28.21% 3.40% -13.95% 21.72% 8.37% -27.08% 50.24% 27.84% 20.30% -3.34% 33.21% 16.50% 22.36% -2.55% 21.26% 17.103% 2.980% 9.493% 16.695% 29.043% 56 57 Note: Sources for annual retums are the Center for Research on Security Prices, Standard & Poor's 500 index, Russell 2000 index, and Solomon-Smith Bamey U.S. Treasury bill index. 58 59 60 61 62 64 65 66 67 68 69 70 71 72 73 74 75 76 77 Table 3.1 Year-by-Year Returns MacBoc
Step by Step Solution
There are 3 Steps involved in it

Get step-by-step solutions from verified subject matter experts