

Question: I need help putting my information together to answer the question listed above my charts. Property Prices - Part 1 Data Ten x Google Sli
I need help putting my information together to answer the question listed above my charts.
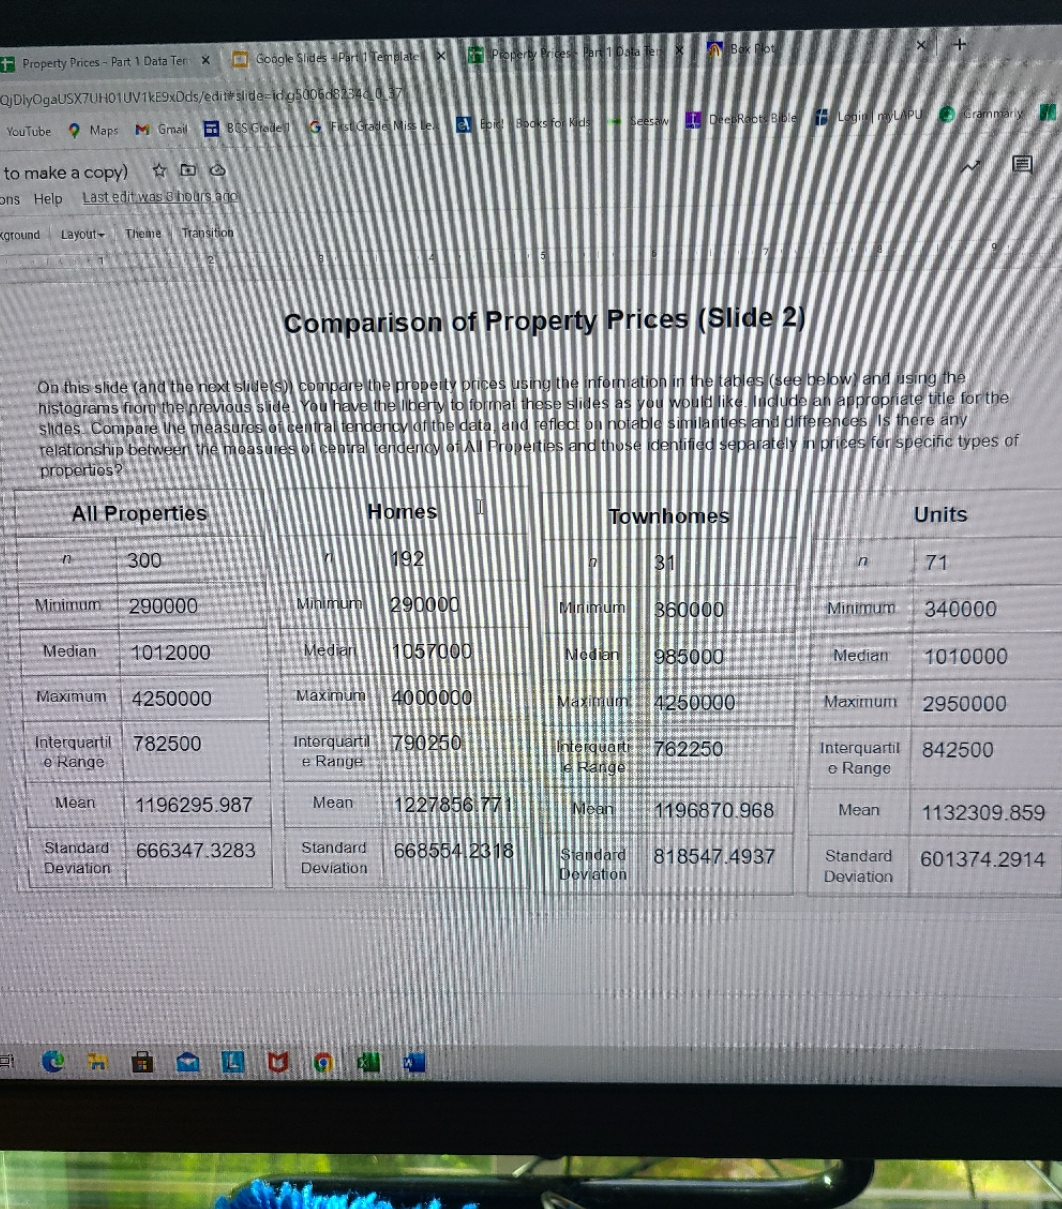
Property Prices - Part 1 Data Ten x Google Sli QjDlyOgaUSX7UH01UV1kE9xDds/edit#slide=ic YouTube Q Maps M Gmail to make a copy) * Do ons Help Last edit was 3 hours. ground Layout- Comparison of Property Prices (Slide 2) On this slide (and the I using the histograms from the previous propriate title for the slides. Compare the meas is there any relationship betwee or specific types of properties? All Properties Units 300 in 71 Minimum 290000 360060 Minimum 340000 Median 1012000 985000 Median 1010000 Maximum 4250000 Maximum 4250000 Maximum 2950000 Interquartil 782500 Interquartil| 790250 Interquartil e Range e Range 842500 e Range Mean 1196295.987 Mean 1227856 77 1196870.968 Mean 1132309.859 Standard 666347.3283 Standard 668554 2318 Deviation Standard 818547.4937 Standard Deviation 601374.2914 Deviation Deviation
Step by Step Solution
There are 3 Steps involved in it

Get step-by-step solutions from verified subject matter experts