

Question: I need help to answer in simple terms A-E please Craik and Lockhart (1972) proposed a model of memory that the degree to which verbal
I need help to answer in simple terms A-E please 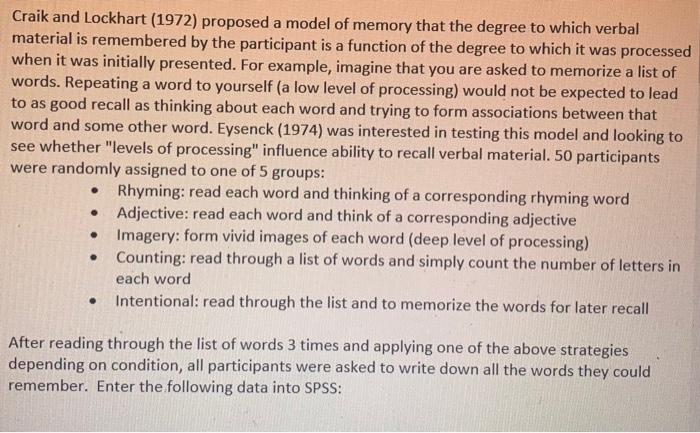
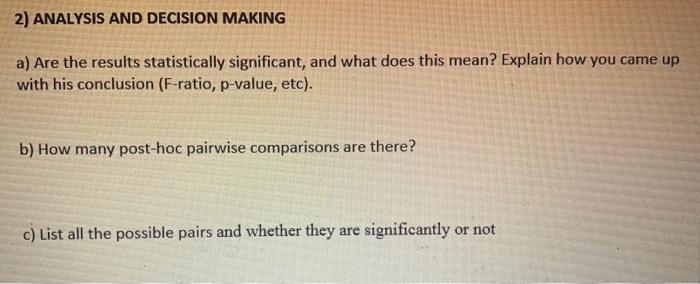
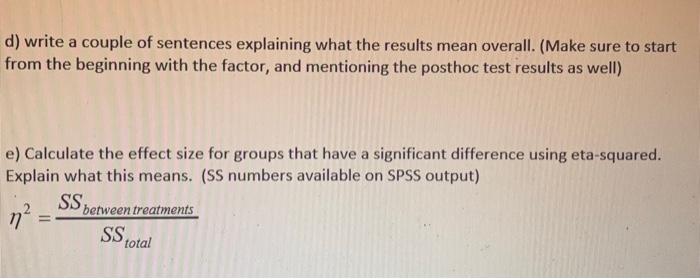
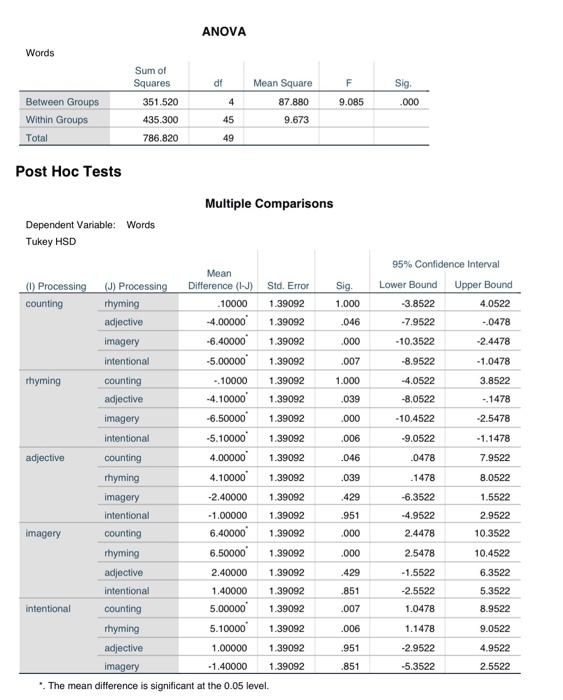
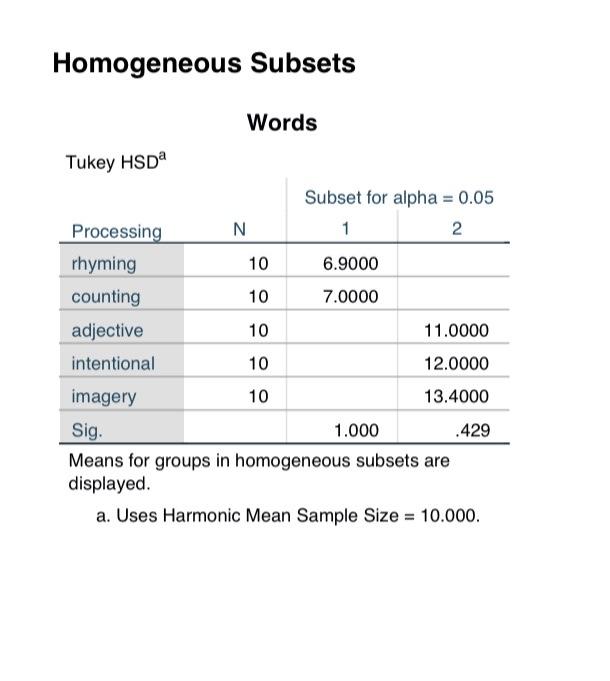
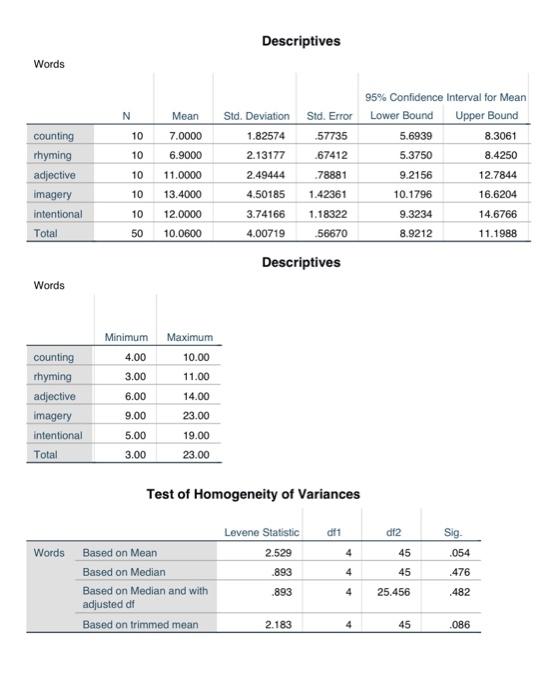
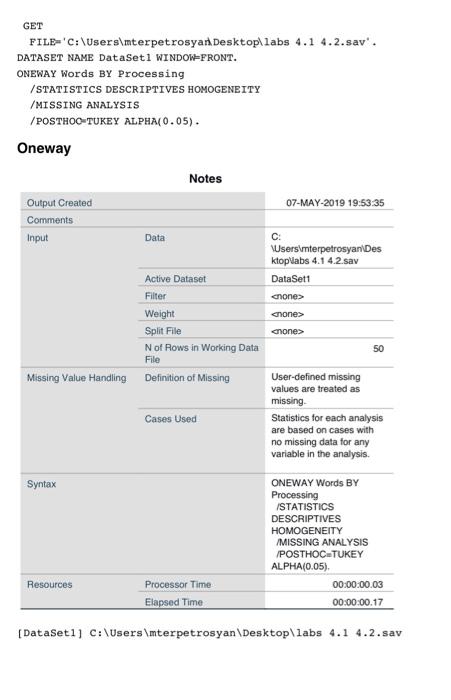
Craik and Lockhart (1972) proposed a model of memory that the degree to which verbal material is remembered by the participant is a function of the degree to which it was processed when it was initially presented. For example, imagine that you are asked to memorize a list of words. Repeating a word to yourself (a low level of processing) would not be expected to lead to as good recall as thinking about each word and trying to form associations between that word and some other word. Eysenck (1974) was interested in testing this model and looking to see whether "levels of processing" influence ability to recall verbal material. 50 participants were randomly assigned to one of 5 groups: Rhyming: read each word and thinking of a corresponding rhyming word Adjective: read each word and think of a corresponding adjective Imagery: form vivid images of each word (deep level of processing) Counting: read through a list of words and simply count the number of letters in each word Intentional: read through the list and to memorize the words for later recall . . After reading through the list of words 3 times and applying one of the above strategies depending on condition, all participants were asked to write down all the words they could remember. Enter the following data into SPSS: 2) ANALYSIS AND DECISION MAKING a) Are the results statistically significant, and what does this mean? Explain how you came up with his conclusion (F-ratio, p-value, etc). b) How many post-hoc pairwise comparisons are there? c) List all the possible pairs and whether they significantly or not d) write a couple of sentences explaining what the results mean overall. (Make sure to start from the beginning with the factor, and mentioning the posthoc test results as well) e) Calculate the effect size for groups that have a significant difference using eta-squared. Explain what this means. (SS numbers available on SPSS output) SS, n2 = between treatments SS total ANOVA Words dt Sum of Squares 351.520 435.300 F 9.085 Mean Square 87.880 9.673 Sig. .000 Between Groups Within Groups Total 4 45 786.820 49 Post Hoc Tests Multiple Comparisons Dependent Variable: Words Tukey HSD 95% Confidence interval Lower Bound Sig 1.000 Upper Bound 4.0522 -3.8522 -7.9522 .046 - 0478 .000 -10.3522 -2.4478 .007 -8.9522 -1.0478 -4.0522 3.8522 1.000 .039 - 1478 -8.0522 -10.4522 .000 -2.5478 .006 -9.0522 -1.1478 .046 .0478 7.9522 .039 .1478 Mean (1) Processing (J) Processing Difference (1-1) Std. Error counting rhyming -10000 1.39092 adjective 4.00000 1.39092 Imagery -6.40000 1.39092 intentional -5.00000 1.39092 rhyming counting -10000 1.39092 adjective -4.10000 1.39092 imagery -6.50000 1.39092 intentional -5.10000 1.39092 adjective counting 4.00000 1.39092 rhyming 4.10000 1.39092 Imagery -2.40000 1.39092 intentional -1.00000 1.39092 imagery counting 6.40000 1.39092 rhyming 6.50000 1.39092 adjective 2.40000 1.39092 intentional 1.40000 1.39092 intentional counting 5.00000 1.39092 rhyming 5.10000 1.39092 adjective 1.00000 1.39092 imagery -1.40000 1.39092 The mean difference is significant at the 0.05 level. 8.0522 429 1.5522 .951 -6.3522 -4.9522 2.4478 2.9522 .000 10.3522 .000 2.5478 10.4522 429 -1.5522 .851 .007 -2.5522 1.0478 6.3522 5.3522 8.9522 .006 1.1478 9.0522 .951 4.9522 -2.9522 -5.3522 851 2.5522 Homogeneous Subsets Words Tukey HSD Subset for alpha = 0.05 Processing N 1 2 rhyming 10 6.9000 counting 10 7.0000 adjective 10 11.0000 intentional 10 12.0000 imagery 10 13.4000 Sig. 1.000 .429 Means for groups in homogeneous subsets are displayed a. Uses Harmonic Mean Sample Size = 10.000. Descriptives Words N 10 10 Mean 7.0000 6.9000 11.0000 13.4000 counting rhyming adjective imagery intentional Total 95% Confidence interval for Mean Std. Deviation Std. Error Lower Bound Upper Bound 1.82574 57735 5.6939 8.3061 2.13177 .67412 5.3750 8.4250 2.49444 .78881 9.2156 12.7844 4.50185 1.42361 10.1796 16.6204 3.74166 1.18322 9.3234 14.6766 4.00719 56670 8.9212 11.1988 10 10 10 12.0000 10.0600 50 Descriptives Words counting rhyming adjective imagery intentional Total Minimum Maximum 4.00 10.00 3.00 11.00 6.00 14.00 9.00 23.00 5.00 19.00 3.00 23.00 Test of Homogeneity of Variances df2 Levene Statistic 2.529 .893 Sig. .054 4 45 4 45 .476 Words Based on Mean Based on Median Based on Median and with adjusted at Based on trimmed mean .893 4 25.456 .482 2.183 4 45 .086 GET FILE='C:\Users\mterpetrosyan Desktop labs 4.1 4.2.sav'. DATASET NAME DataSet 1 WINDOW=FRONT. ONEWAY Words BY Processing /STATISTICS DESCRIPTIVES HOMOGENEITY /MISSING ANALYSIS /POSTHOO-TUKEY ALPHA(0.05). Oneway Notes 07-MAY-2019 19:53:35 Output Created Comments Input Data Active Dataset Filter Weight Split File N of Rows in Working Data File Missing Value Handling Definition of Missing C \Users interpetrosyan Des ktoplabs 4.1 4.2. sav DataSett chones chones chone 50 Cases Used User-defined missing values are treated as missing Statistics for each analysis are based on cases with no missing data for any variable in the analysis. Syntax ONEWAY Words BY Processing /STATISTICS DESCRIPTIVES HOMOGENEITY /MISSING ANALYSIS /POSTHOCTUKEY ALPHA(0.05) Resources Processor Time 00:00:00.03 Elapsed Time 00:00:00.17 [DataSet1] C:\Users\mterpetrosyan\Desktop\labs 4.1 4.2.sav Step by Step Solution
There are 3 Steps involved in it
1 Expert Approved Answer
Step: 1 Unlock

Question Has Been Solved by an Expert!
Get step-by-step solutions from verified subject matter experts
Step: 2 Unlock
Step: 3 Unlock