

Question: I need help understanding what the question is asking, I am more so looking for an explanation and example so I can understand. Thank you
I need help understanding what the question is asking, I am more so looking for an explanation and example so I can understand. Thank you !
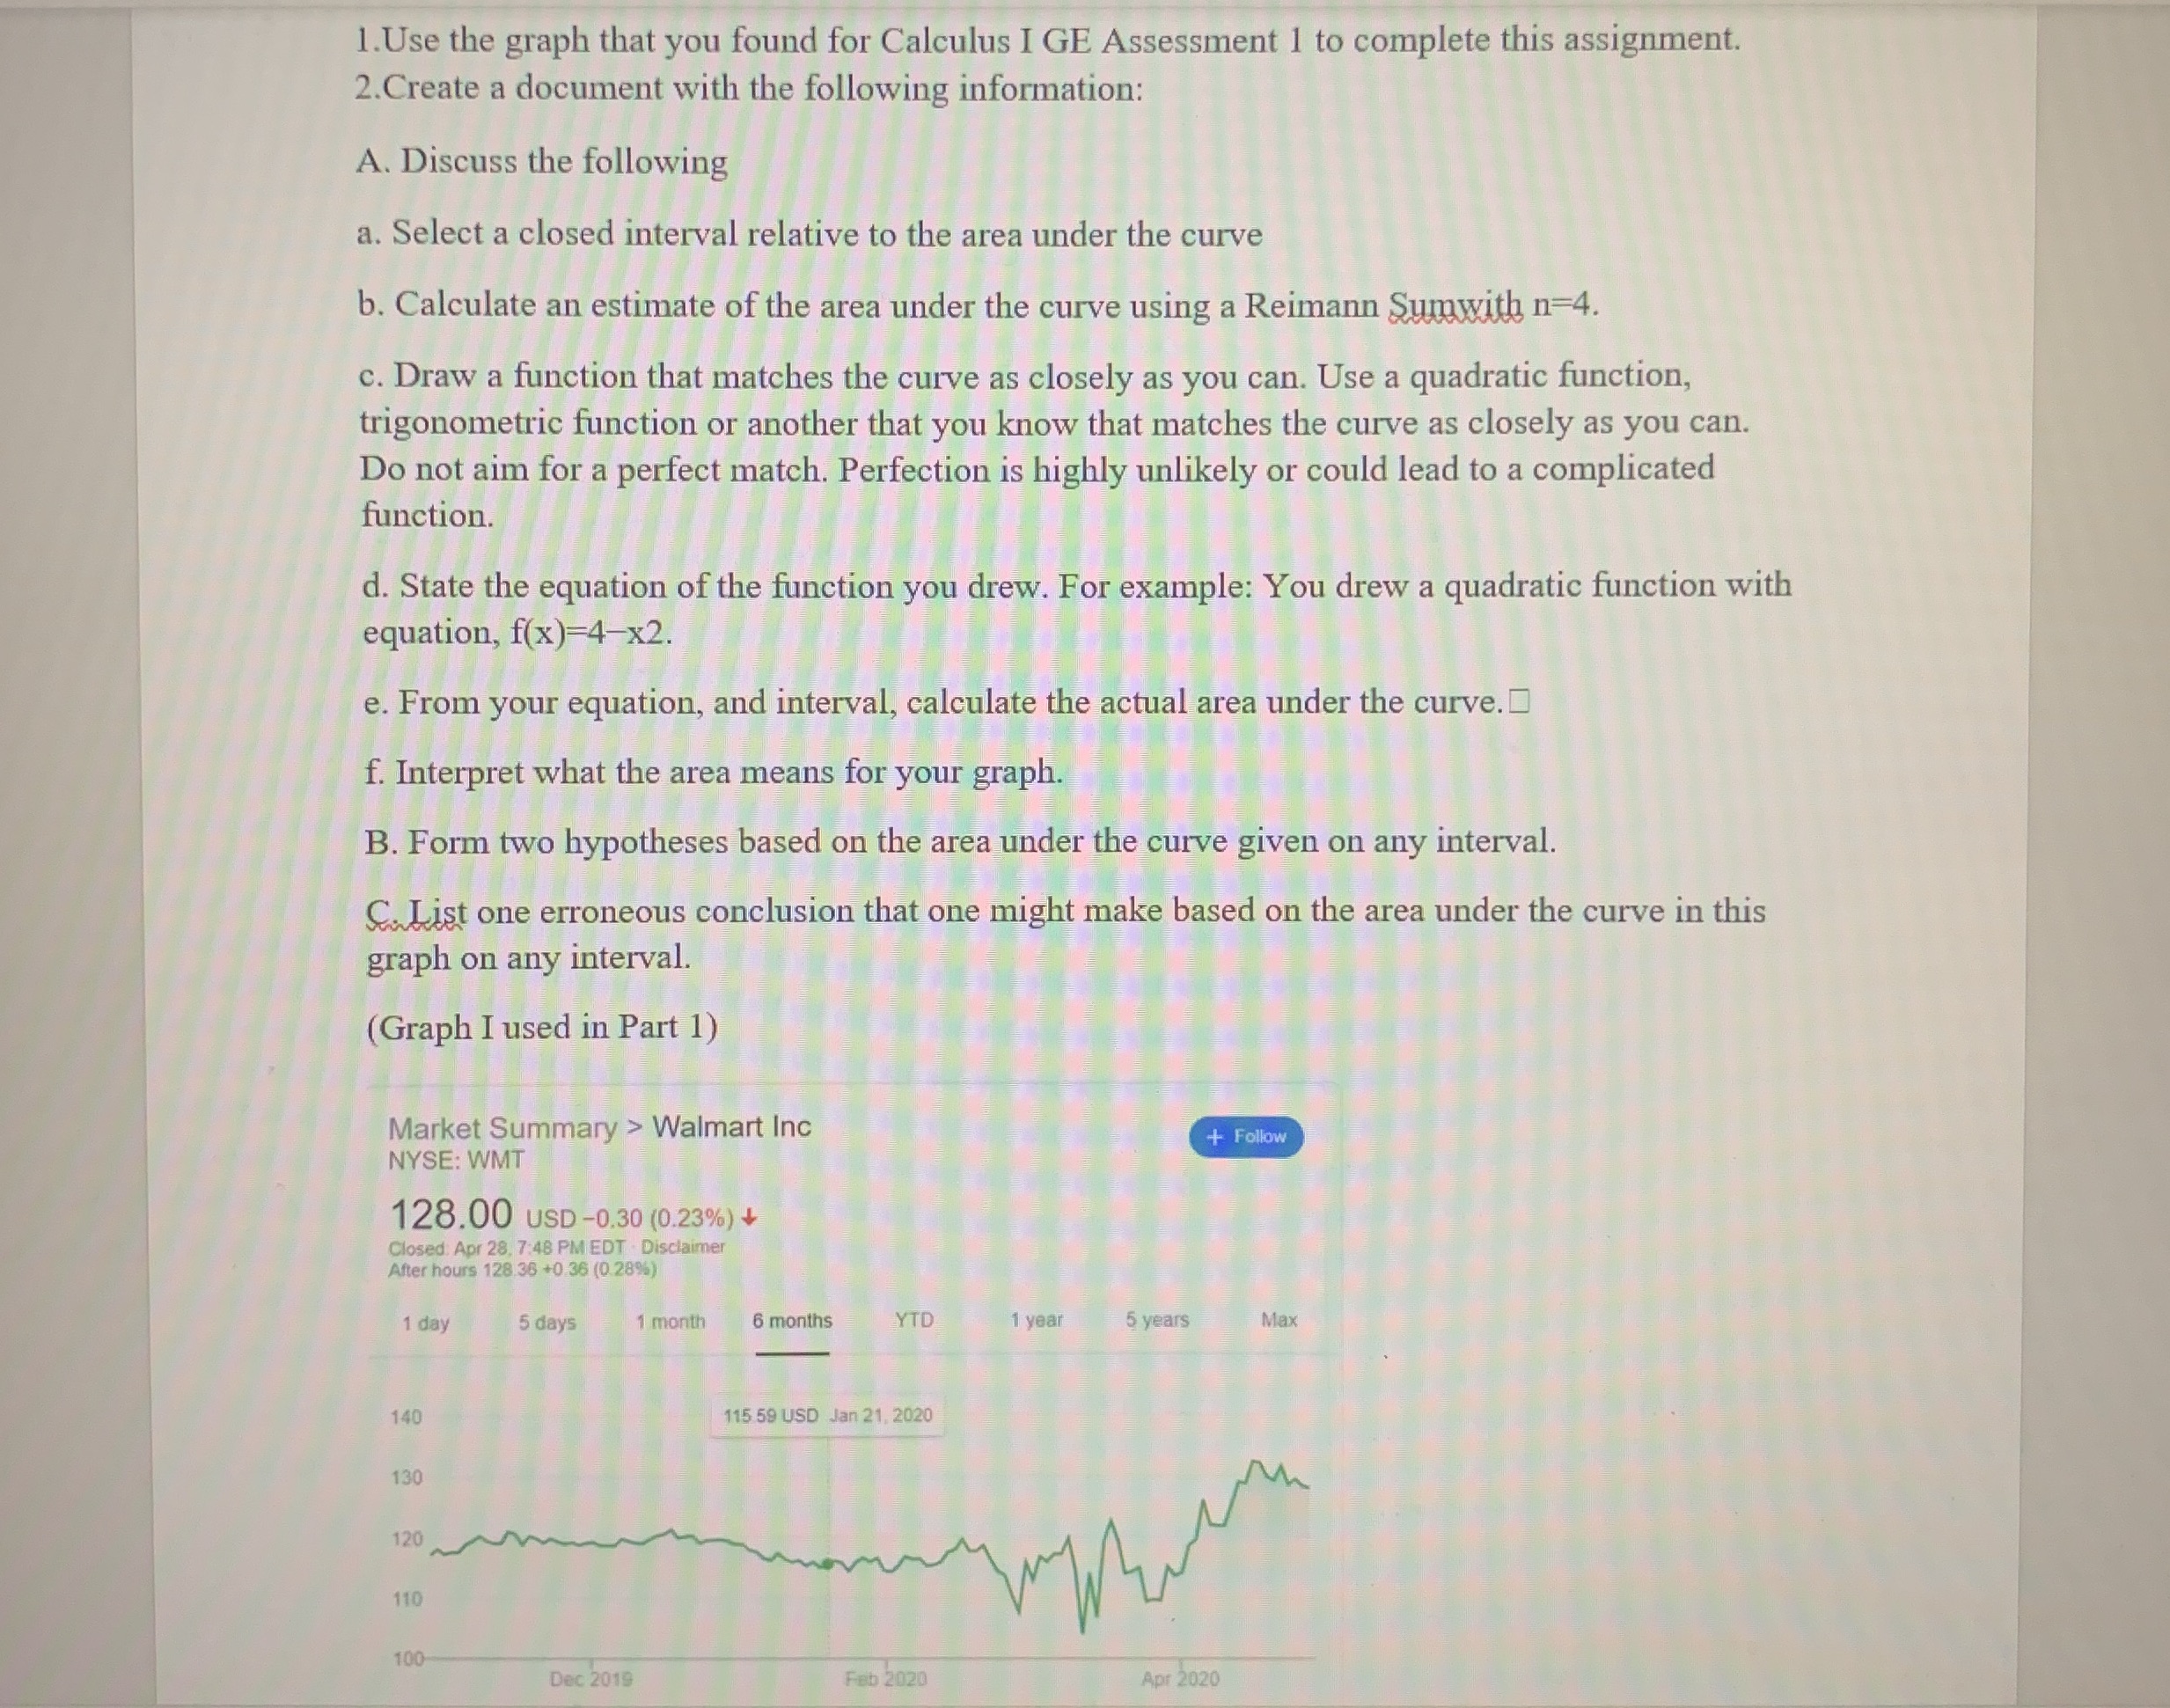
1. Use the graph that you found for Calculus I GE Assessment 1 to complete this assignment. 2. Create a document with the following information: A. Discuss the following a. Select a closed interval relative to the area under the curve b. Calculate an estimate of the area under the curve using a Reimann Sumwith n=4. c. Draw a function that matches the curve as closely as you can. Use a quadratic function, trigonometric function or another that you know that matches the curve as closely as you can. Do not aim for a perfect match. Perfection is highly unlikely or could lead to a complicated function. d. State the equation of the function you drew. For example: You drew a quadratic function with equation, f(x)-4-x2. e. From your equation, and interval, calculate the actual area under the curve. f. Interpret what the area means for your graph. B. Form two hypotheses based on the area under the curve given on any interval. C. List one erroneous conclusion that one might make based on the area under the curve in this graph on any interval. (Graph I used in Part 1) Market Summary > Walmart Inc NYSE: WMT + Follow 128.00 USD -0,30 (0.23%) + Closed Apr 28, 7:48 PM EDT . Disclaimer After hours 128,36 +0.36 (0.289%) 1 day 5 days 1 month 6 months YTD 1 year 5 years Max 140 115 59 USD Jan 21, 2020 130 120 110 100 Dec 2019 Feb 2020 Apr 2020
Step by Step Solution
There are 3 Steps involved in it

Get step-by-step solutions from verified subject matter experts