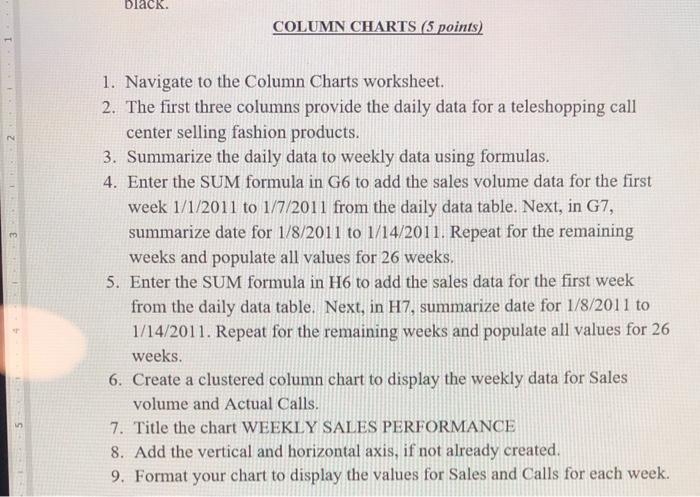
Question: I need help with creating a formula that changes the data by weeks to create a sum from the daily totals. I dont know if

I need help with creating a formula that changes the data by weeks to create a sum from the daily totals. I dont know if that makes sense but I dont know how to make it easier than manually entering the data for each week. I need help with creating a formula that changes
I need help with creating a formula that changes
G EGES 5 - 9 IN C D 5 Daily Data Weekly Data Weet Calls 100 150 164 194 au CU 11 2 00 Weekly Sales Performance IPE PU 1 314 1 O Date: Sales volume: Actual cas 1/1/2011 12 10 12 2011 14 11 13/2011 110 10 14/2011 15 12 10 1/2011 1 11/2011 1 1 11 7/2011 13 2011 15 10 1 2011 21 10 13/10/2011 22 11 10/11/2011 23 10 17 TOTT 22 19 1/11/2011 20 13 101/14/2011 20 13 201710/2011 25 12 21: 1/6/2011 25 10 21/11/2011 10 23 1/18/2011 11 21/10/2011 10 25 1/20/2011 12 20 121/2011 22 13 27 1/22/2011 96 13 28 1/23/2011 27 12 29 1/24/2011 28 10 30272011 29 10 11 10/2011 29 11 32 1/27/2011 27 14 Column Charts Pie Charts CA 78 70 79 E- 09 . 31 10EB 19 20" 21 20 54 . 19 450 DO 23 24 25 20 475 c AutoSave Ott 2 EX File Home Insert Draw Page Layout Forms Atial 10 - , Prista & Cut La Copy Format Painter Clipboard 6 BIU a-A Fone N29 D 15 18 A B C 31 1/26/2011 29 11 32 1/27/2011 27 14 33 1/28/2011 29 12 34 1/29/2011 28 13 35 1/30/2011 30 13 36 1/31/2011 31 13 37 2/1/2011 31 10 38 2/2/2011 32 10 39 2/3/2011 35 12 40 2/4/2011 32 13 41 2/5/2011 36 16 42 2/6/2011 37 43 2/7/2011 33 17 44 2/8/2011 35 17 45 2/9/2011 35 19 46 2/10/2011 33 47 2/11/2011 37 17 48 2/12/2011 38 18 49 2/13/2011 39 18 50 2/14/2011 44 19 51 2/15/2011 41 20 52 2/16/2011 42 21 53 2/17/2011 44 20 54 2/18/2011 16 55 2/19/2011 43 15 56 2/20/2011 44 17 57 2/21/2011 17 58 2/22/2011 45 19 59 2/23/2011 45 18 60 2/24/2011 47 17 61 2/25/2011 45 18 f2 2/26/2011 45 18 Column Charts Pie Charts + black COLUMN CHARTS (5 points) Z 1. Navigate to the Column Charts worksheet. 2. The first three columns provide the daily data for a teleshopping call center selling fashion products. 3. Summarize the daily data to weekly data using formulas. 4. Enter the SUM formula in G6 to add the sales volume data for the first week 1/1/2011 to 1/7/2011 from the daily data table. Next, in G7, summarize date for 1/8/2011 to 1/14/2011. Repeat for the remaining weeks and populate all values for 26 weeks. 5. Enter the SUM formula in H6 to add the sales data for the first week from the daily data table. Next, in H7, summarize date for 1/8/2011 to 1/14/2011. Repeat for the remaining weeks and populate all values for 26 weeks. 6. Create a clustered column chart to display the weekly data for Sales volume and Actual Calls. 7. Title the chart WEEKLY SALES PERFORMANCE 8. Add the vertical and horizontal axis, if not already created. 9. Format your chart to display the values for Sales and Calls for each week. 5

Step by Step Solution

There are 3 Steps involved in it

1 Expert Approved Answer
Step: 1 Unlock blur-text-image
Question Has Been Solved by an Expert!

Get step-by-step solutions from verified subject matter experts

Step: 2 Unlock
Step: 3 Unlock

Students Have Also Explored These Related General Management Questions!