

Question: I need help with part B. Not sure how to code for it. It should be in R language For each of the following distributions:
I need help with part B. Not sure how to code for it. It should be in R language
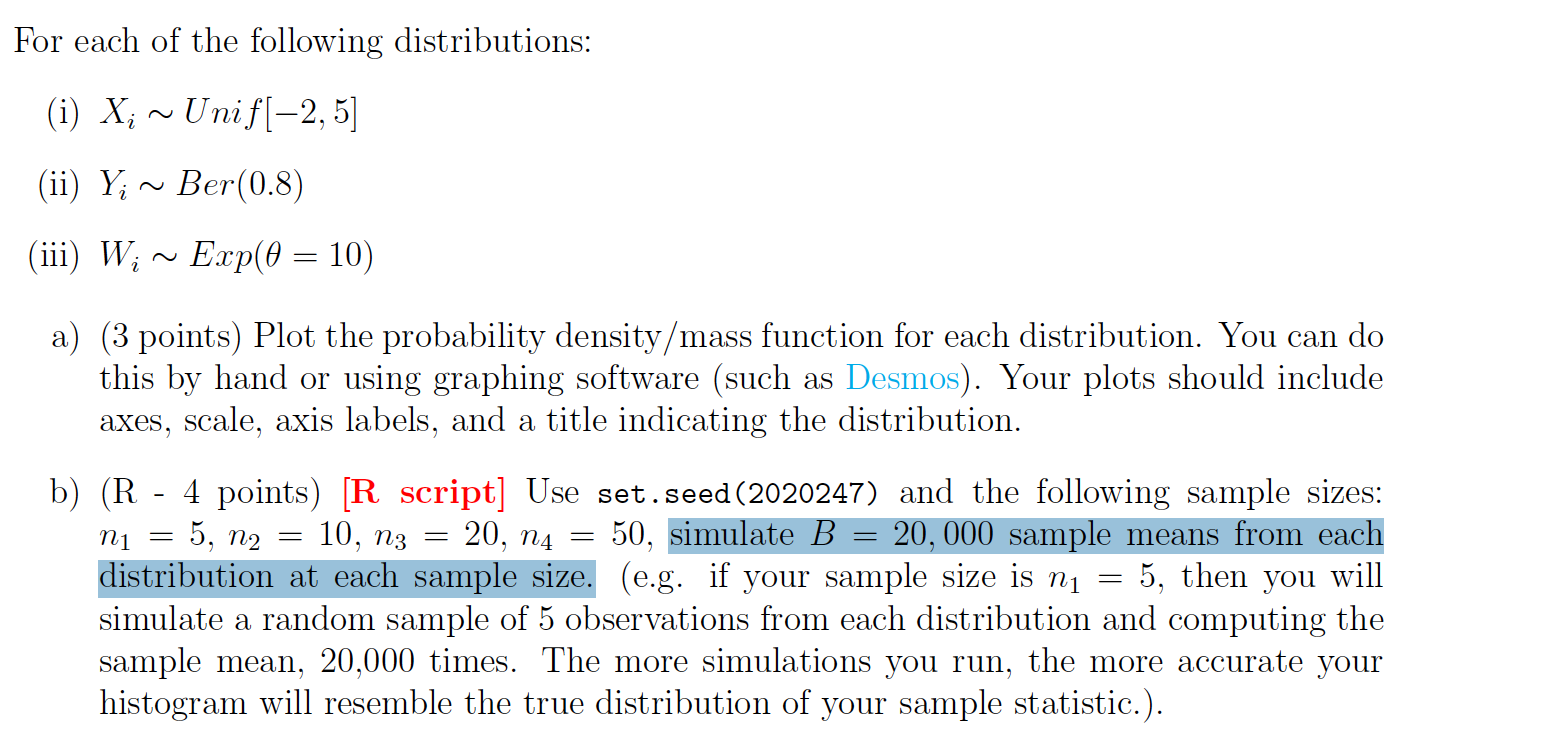
For each of the following distributions: (i) X,- N Unif[2, 5] (ii) Y,- N Ber(0.8) (iii) W,- N Emp(6 = 10) a) (3 points) Plot the probability density/ mass function for each distribution. You can do this by hand or using graphing software (such as Desmos). Your plots should include axes, scale, axis labels, and a title indicating the distribution. b) (R 4 points) [R script] Use set.seed(2020247) and the following sample sizes: n1=5,n2=1o,n3=2o,n4=50, (eg. if your sample size is n1 2 5, then you will simulate a random sample of 5 observations from each distribution and computing the sample mean, 20,000 times. The more simulations you run, the more accurate your histogram Will resemble the true distribution of your sample statistic)
Step by Step Solution
There are 3 Steps involved in it

Get step-by-step solutions from verified subject matter experts