

Question: i need help with question #2 please for position vs. time data. 1. This table gives the position of a glider as a function of
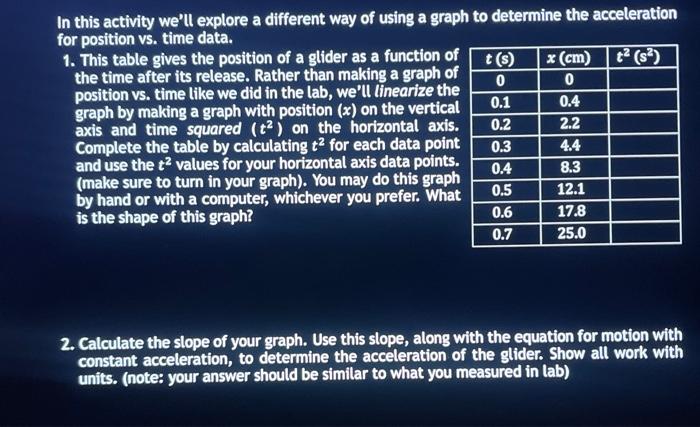
for position vs. time data. 1. This table gives the position of a glider as a function of the time after its release. Rather than making a graph of position vs. time like we did in the lab, we'll linearize the graph by making a graph with position (x) on the vertical axis and time squared (t2) on the horizontal axis. Complete the table by calculating t2 for each data point and use the t2 values for your horizontal axis data points. (make sure to turn in your graph). You may do this graph by hand or with a computer, whichever you prefer. What is the shape of this graph? 2. Calculate the slope of your graph. Use this slope, along with the equation for motion with constant acceleration, to determine the acceleration of the glider. Show all work with units. (note: your answer should be similar to what you measured in lab)
Step by Step Solution
There are 3 Steps involved in it

Get step-by-step solutions from verified subject matter experts